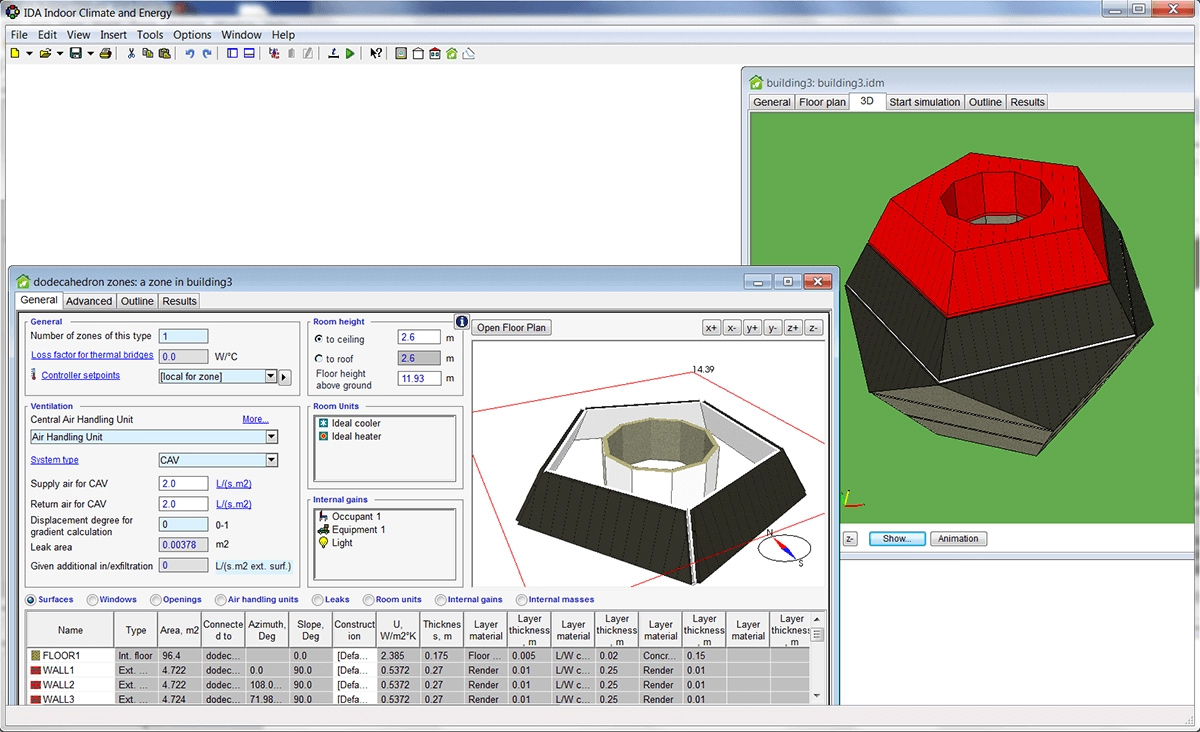
Previous versions
Below is a list of the most important news in previous versions of IDA ICE.
 Multi-Objective Optimization1
|
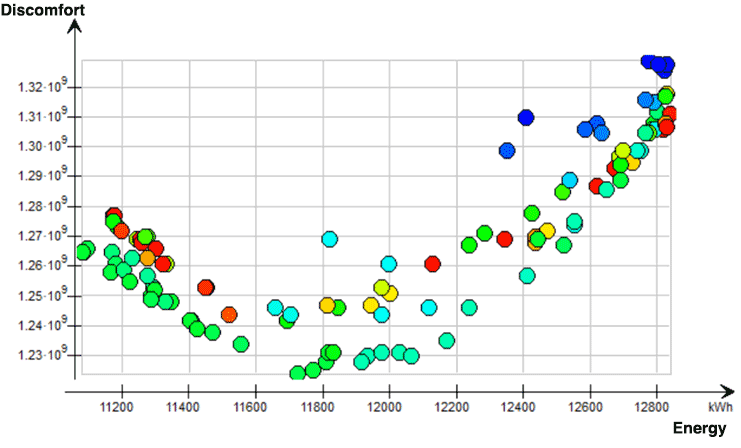
Up till now, automatic optimization in IDA ICE has been practically limited to a handful of parameters using brute force methods or similar. Now, using Multi-Objective Optimization, with an easy to set-up system, users can combine large number of parameters including different simulation types (daylight versus overheating and heating) in the same optimization.
This allows users to easily study complex real-life problems in an efficient way using powerful guiding algorithm that automatically selects the best optimization algorithms and their appropriate parameters. Built with reproducibility in mind, users can be assured to attain the optimal results every time.
- Easy to set-up.
- Supports single and multiple objectives.
- Supports a mix of categorical parameters (i.e. list selections), integers, and real parameters with arbitrary precision.
- Supports user-defined objective functions through graphical scripts.
- Possibility to add calculated results from reports, e.g. the delivered energy report, to outputs.
- Pause and save functionality gives the user full control over the optimization process.
- Integrated within the already appreciated parametric runs interface.
|
Improved productivity
|
Automatic DWG conversion
Non supported DWG-files can be automatically converted into supported versions, both DWG and DXF, using internal or manually added open-source conversion tools.
Divide thermal zones by IFC walls2
IFC walls can optionally divide thermal zones during creation with correct thickness. This shortens modeling time substantially in projects where IFC models without spaces are available.
 
Adjust thermal spaces to IFC2
Wall constructions, windows and doors in thermal zones can automatically be created based upon surrounding IFC objects using the new command “Adjust to IFC”.
Multiple selections
Multiple objects can be selected in 3D or details tables and views are synchronized for easy object identification.

Additional Details tables
A large number of Details tables have been added, for example building bodies, IFC- and CAD-objects, wall parts, sensors and terminals. This can be used for sorting, selecting and editing objects parameters in a simple and efficient way, visualizing object parameters in 3D and run commands on selected objects. Example of new commands are “Run script” (only available in Expert version of IDA ICE) and duplication of object into other object types. Tables are now grouped for easy access.

Additional Details table columns
A number of new columns have been added to details tables for simple editing and visualization in 3D. Some examples are:
- Zone model type and room height to roof
- Rooms units area and heating and cooling power per square meter
- Clothing and location for internal loads
- Many new surface and window parameters including calculated frame width
- Annotations
There are also two highly customizable new zone parameters, “Custom text” and “Custom numbers” that can be used for grouping, scripting, data storage or visualization.
Simplified object creation and editing
One or many objects on surfaces and facades can easily be created using the improved insert command. This command allows the creation on any selected surfaces in details tables and 3D. Users have the option to fill a given part of selected surfaces with objects in an array. Objects can easily be shaped to non-rectangular surfaces with given offset using the new command “Update shape to geometry”.

Flexible IFC geometry import2
Users can now choose what IFC geometries to import based upon IFC element type to improve import speed and memory usage. It is also possible to import IFC site objects, spaces, windows and openings as geometries. This makes it possible to, for example, create sloping roof windows and non-prismatic thermal spaces based upon IFC. IFC spaces are visualized in 3D to validate import and to easily compare against IFC space geometries. It is also possible to import more complex IFC geometries than before with a customizable maximum number of faces and polygons.

Improved building body modeling
A large number of new commands have been added to simplify the creation of complex building bodies without using external CAD tools. Some of these are:
- Extrude selected measuring planes into building bodies vertically or perpendicular to a façade or surface.
- Split building bodies with level like slabs for zones.
- Boolean operations like crop and merge building bodies.
- Convert imported CAD- or IFC objects into building bodies. This is especially useful for creating building bodies from slabs.
- Extrude CAD- or IFC objects into building bodies. This is especially useful for creating building bodies from sloping roofs.
Duplicate object into other object types
A number of objects can be duplicated into other object types to avoid usage of external tools.
- Duplicate building bodies into imported CAD objects and vice versa. This allows users to draw shading objects in floor plan tab and perform complex scaling and rotation on building bodies.
- Duplicate thermal zones into building bodies and vice versa.
- Duplicate IFC- and CAD geometries into CAD objects. This makes it possible to set optical properties like transparency to individual geometrical objects.
- Duplicate extruded objects into CAD objects. This makes it possible to easily create complex shading objects without external CAD tools.
- Duplicate IFC- and CAD geometries into face windows or openings. This makes it possible to create windows and doors from any geometry, for example transparent curtain wall elements.
Zone templates are saved as zone usage type
The template used to create a thermal zone is saved with the zone. This makes it possible to reset one or many properties to template default values or change the template used for selected zones. It is also possible to visualize if any properties differ from selected zone template.
And more!
- Move windows from building bodies to zones and vice versa without scripting.
- Simplified deletion of points during editing by holding down “Delete”.
- Run scripts for selected objects.
- It is no longer possible to perform simulations with missing shading CAD objects.
- IFC import is more robust and no longer require walls.2
|
New 3D animation of simulation results (beta)
|
The 3D animation of simulation results has been moved to a new Animation tab. With this new feature it is now possible to:
- Visualize much larger models and simulation results with vastly improved 3D performance.
- Save any number of animations which include settings of:
- Variable to animate and from which type of simulation.
- Time.
- Scalebar settings including threshold value.
- View point including section cut.
- View settings including visual filter, wall thickness, x-ray, wire frame and background colour.

|
Improved memory management (beta)
|
The diagram handling and the 3D results visualization have been separated into a process, which makes it possible to visualize larger models and diagrams.
|
1 Included in the Expert edition.
 New climate zone model with arbitrary shape and stratification1

|
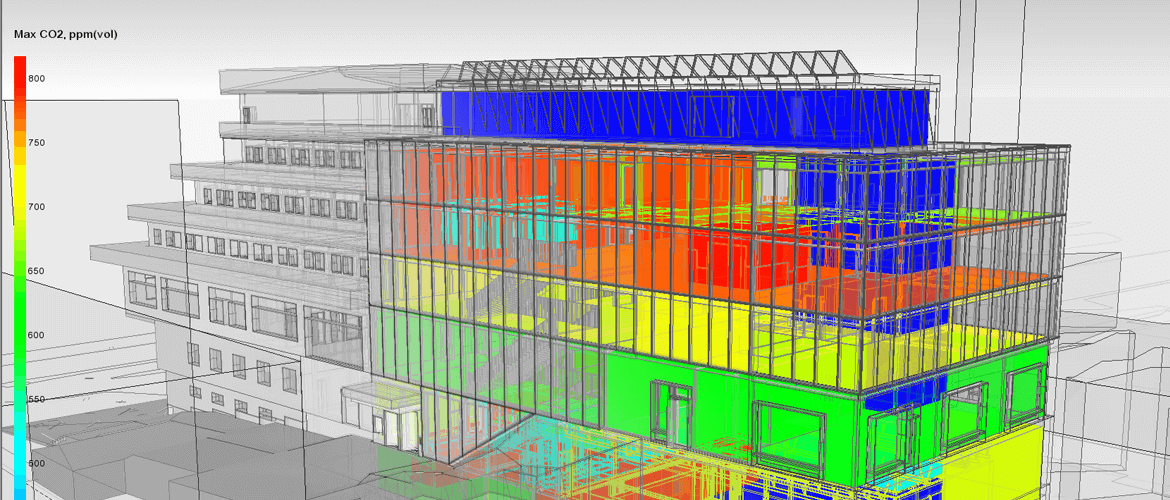
A new zone model for detailed indoor climate analysis with results visualized in a 2D/3D-grid of the zone volume (air temperature, air velocity, operative temperature, draught risk, CO2, PPD, PMV). The new model supports:
- Detailed radiation for arbitrary room geometry (also non-convex) with detailed view factor calculation, for long-wave and diffuse solar radiation exchange between surfaces and between surfaces and occupants.
- Air stratification based on flow elements such as jets, plumes, and wall currents, e.g. cold air draft close to window in winter.
- Operative temperature with, optionally, direct and diffuse short-wave radiation taken into account.
- Equipment and other loads with position in the zone.
- Position dependent sensors.
|
Photovoltaics and battery storage1
|
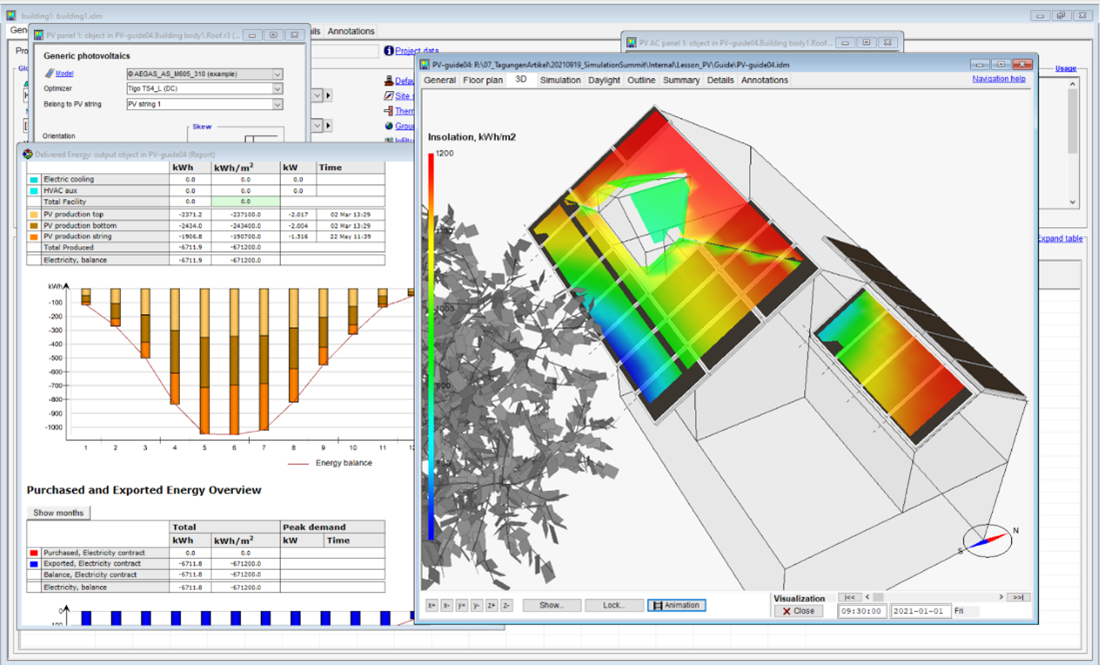
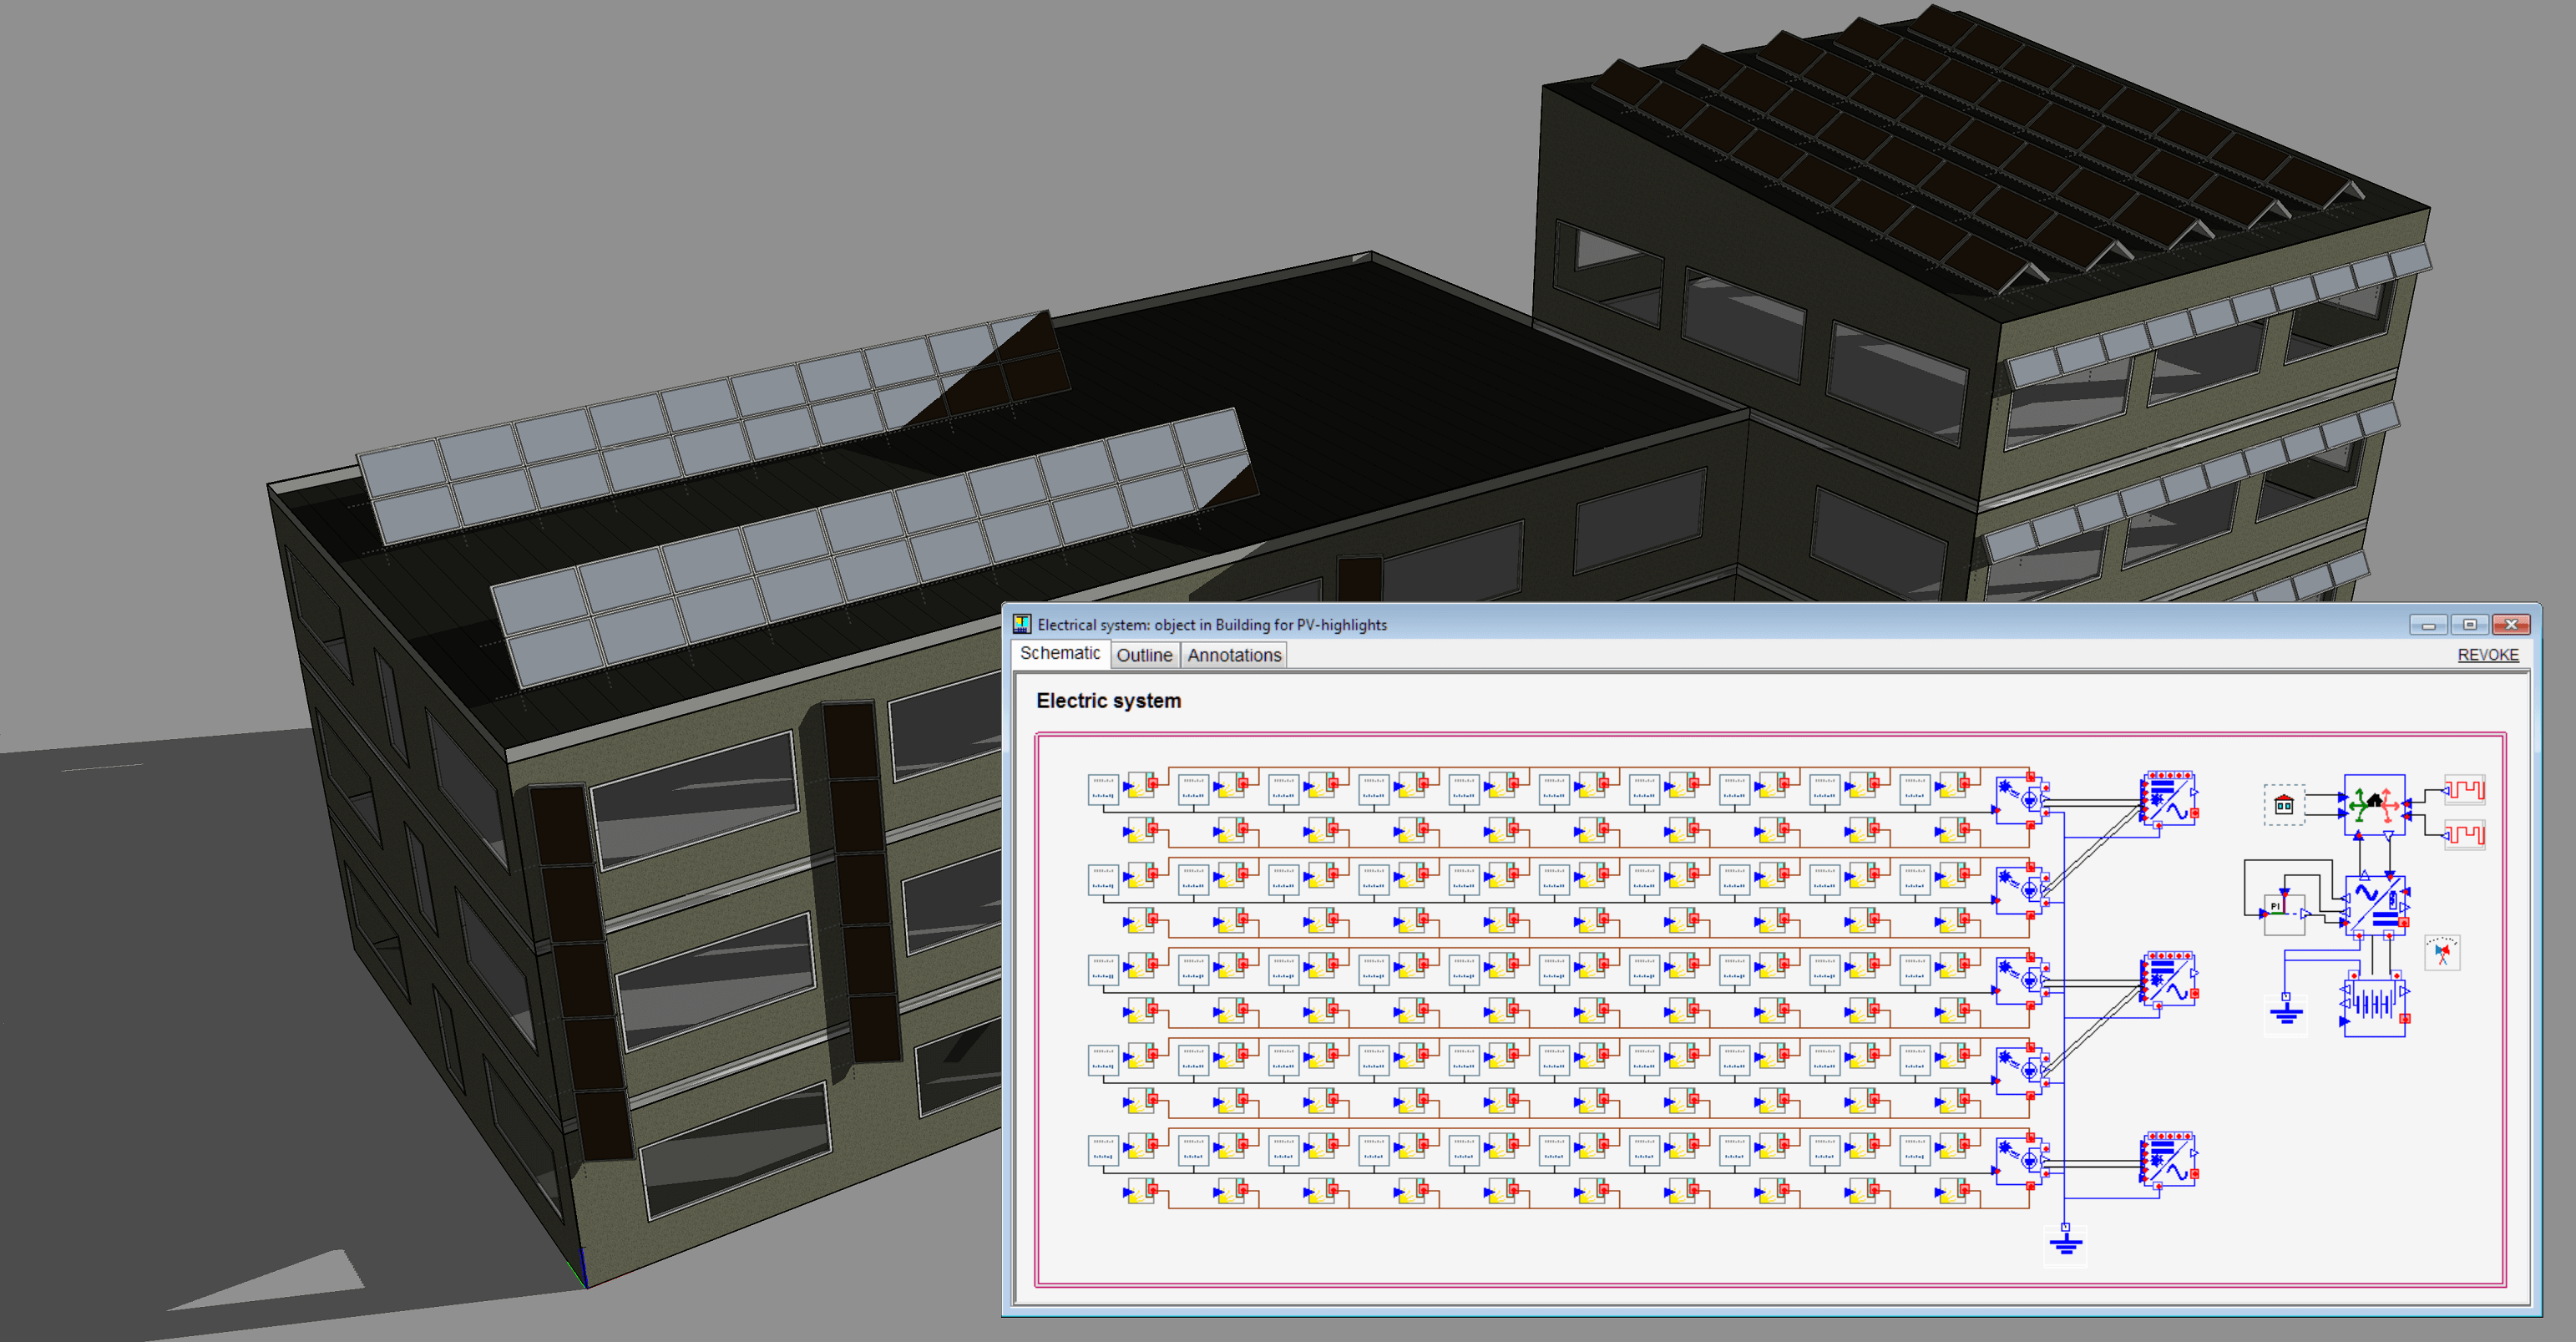
State-of-the-art tool for analysis of building-integrated PV-systems with arbitrary location and multiple arrays. The effect of shading on electricity production due to row-to-row self-shading and shading form surrounding objects is analyzed at cell level. The new tool supports:
- AC modules (PV module + micro inverter).
- DC modules in string configuration with different levels of DC optimizers.
- DC optimizers just for shaded modules (selective deployment).
- Inverter power clipping and load sharing between the inputs.
- Battery storage and energy management system for user-defined battery operation.
- Energy management system to control battery charge/discharge, and energy trading.
- Building to module thermal interaction.
- New Electrical energy report and easy logging of time series in the electrical system.
- Calculation and reports of load matching indicators according to ISO/FDIS 52000-1:2016(E) Annex G.
|
Improvements for Parametric runs1
|
The Parametric runs interface has been improved with these features:
- Supports all available simulation types including daylight (also combinations of simulations).
- Parallel coordinates plot.
|

Improved plant modelling1
|
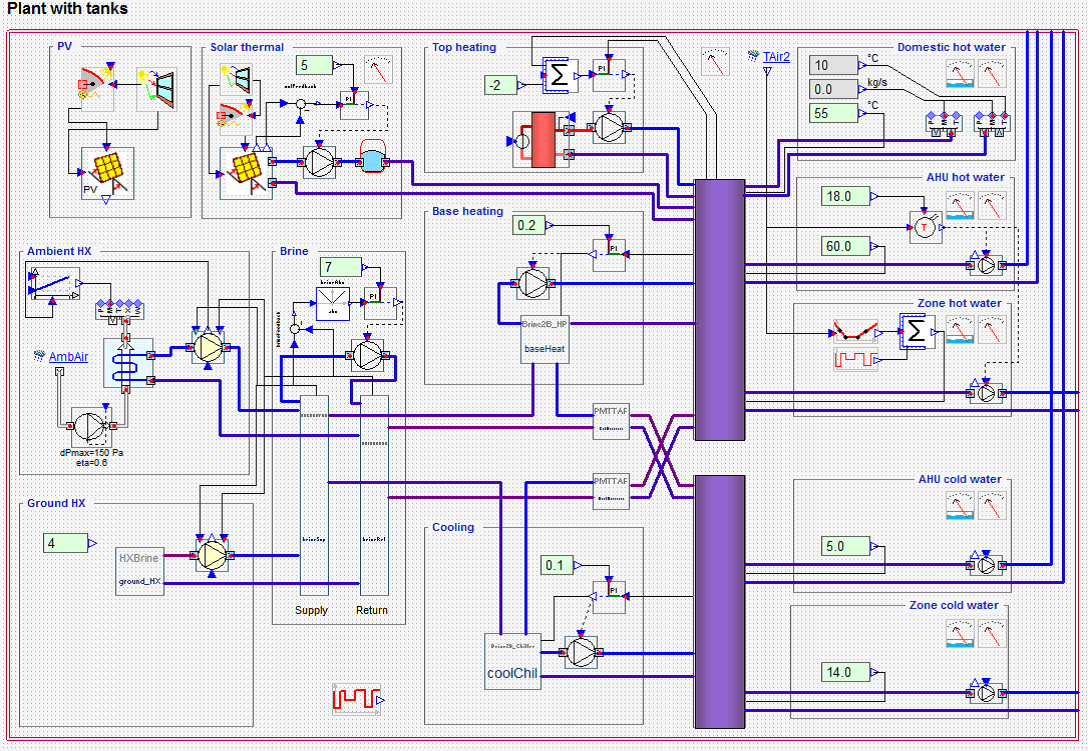
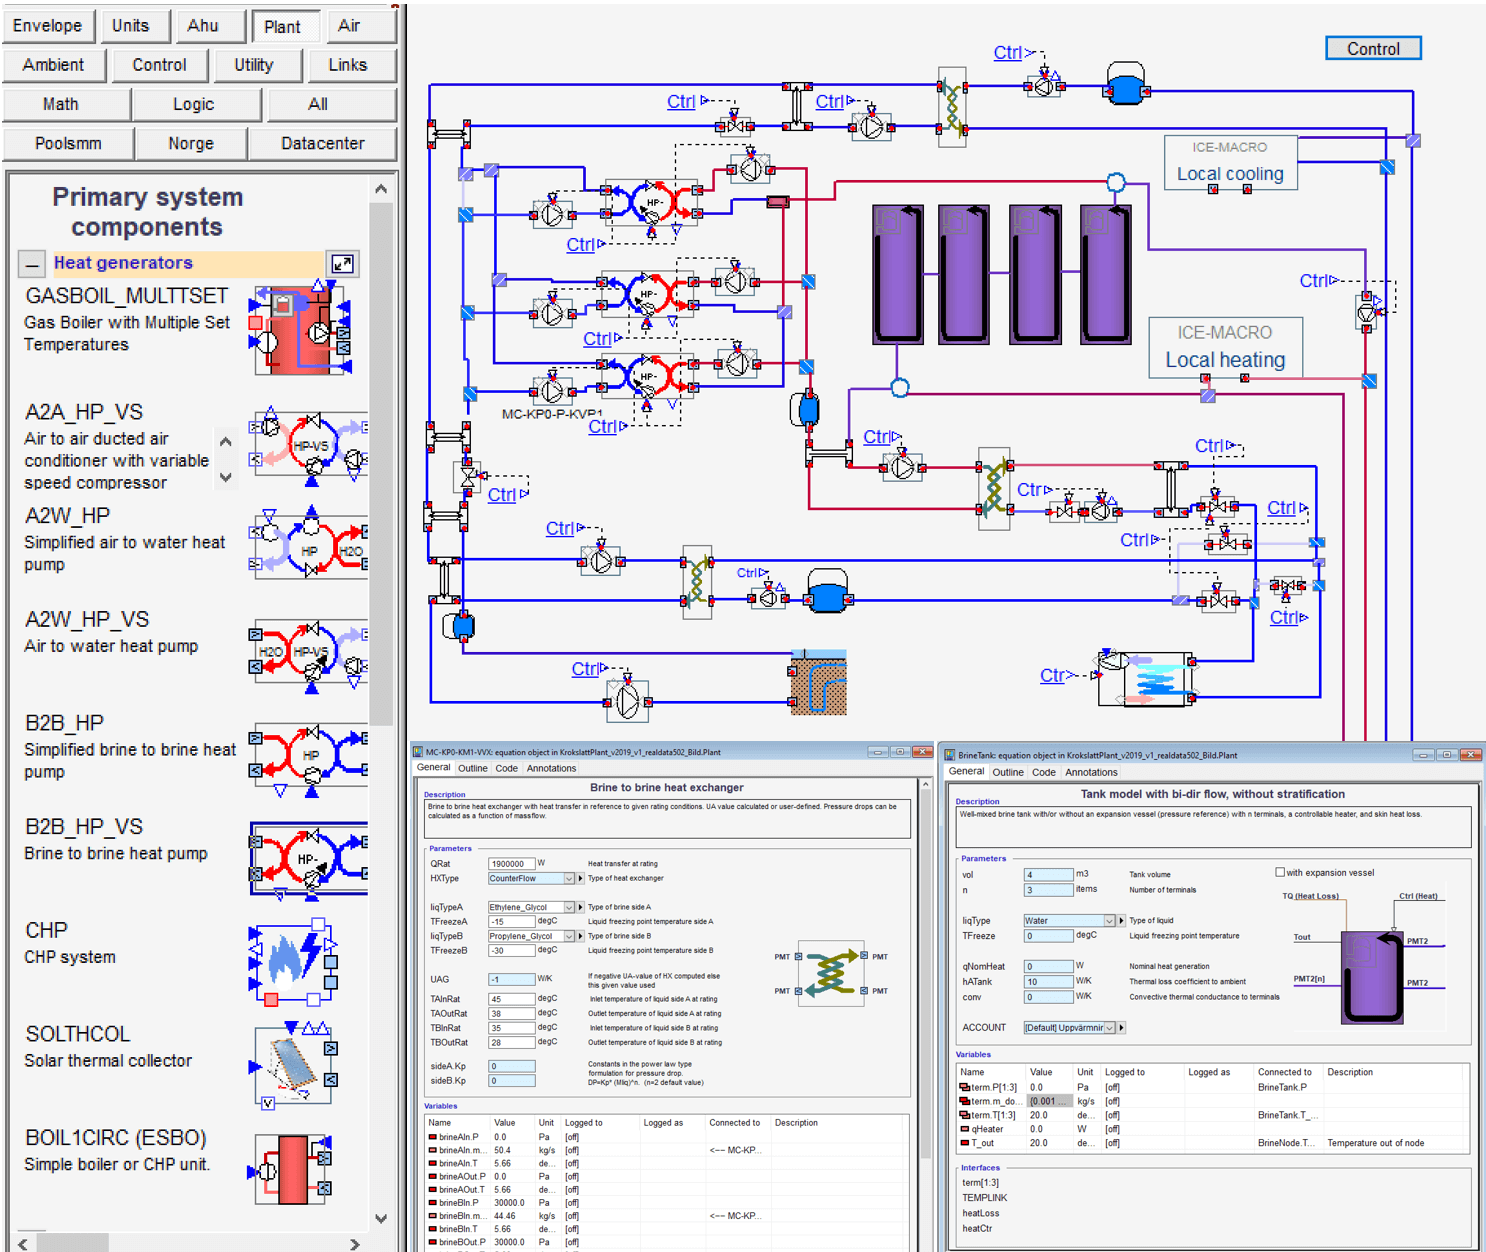
Plant modelling made easier and more powerful with:
- A new flow node model for bi- (or uni-) directional flow paths.
- Plug-flow and finite-difference bi-directional models for pipe network modelling for, e.g., district heating networks.
- A new palette with selected components ordered by functionality.
- Circuit checks allowing the user to identify modelling errors in a simpler way.
- New user forms making it easier to find and understand the main parameters, log variables and get information about the component.
- Product database support for several components, such as heat pumps, solar thermal collectors, and pumps.
|
New heat pump and chiller models
A new model for variable capacity heat pumps and chillers is included. The model is based on the standard polynomials for compressor performance according to EN12900/ARI540. It provides accurate models for a majority of products using compressors in fix speed, variable speed, tandem and multiple staged configurations.
Multiple hot and cold-water distribution circuits
An unlimited number of hot and cold-water circuits from the plant can now be added. It is possible to have different heating and cooling circuits with different temperatures to any room unit or air handling unit.

Improved BIM import and export (only available in ESBO)²
Import zone geometry from CAD models created in CAD tools, e.g. DDS-CAD and MagiCAD, and export simulation results back to the CAD tool. Any CAD tool that can export IFC files with spaces and space boundaries can be supported.
Introduction of zone templates in ESBO. After setting up a number of zone templates with the desired constructions, surface materials, window types, internal gains, indoor climate standard and room units etc., this data is fetched from the zone templates during the BIM import. This method works for both IFC and the new plug-ins.

New Delivered energy report that supports energy production and export
|
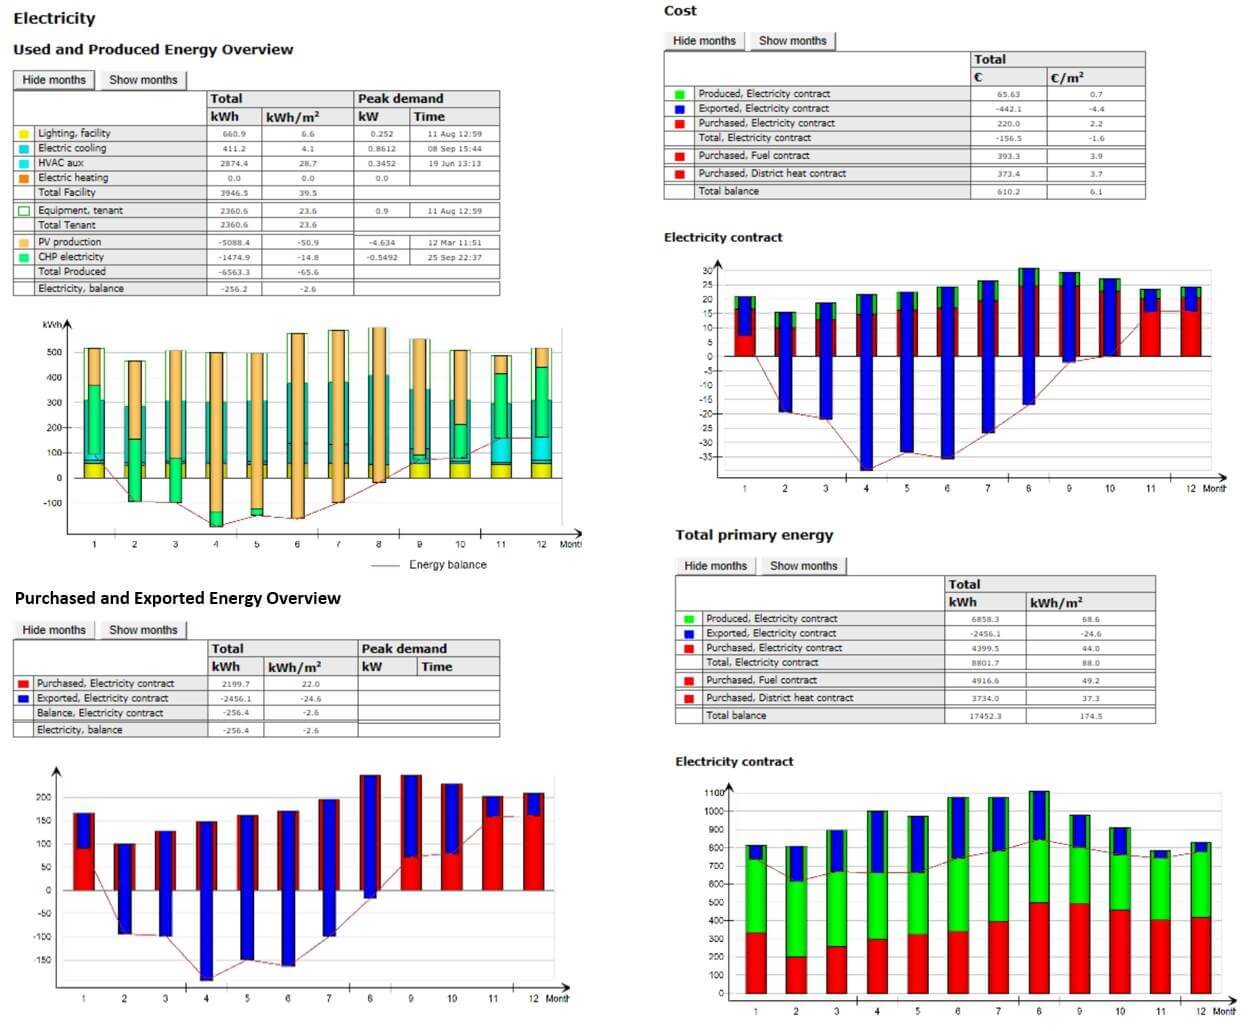
The new report gives an overview over the total energy demand based on EN ISO 52000-1.
- Extended concept of energy meters with new meter roles allows to meter used energy as well as produced, stored or converted energy.
- New object "energy trader" defines economical interests (like utility, facility, tenants, PV plant owners etc.) that can trade energy between each other.
- Primary energy and CO2 factors defined for energy passing the so-called «assessment boundary» ecologically weight delivered and exported electricity, district heating/cooling and fuel.
- New object "energy contract" between traders defines (potentially time-dependent) energy costs.
- Monthly balance per energy carrier containing used, produced, purchased, and exported energy.
- Monthly cost overview per trader.
- Overall total and non-renewable primary energy as well as CO2 emission.
|
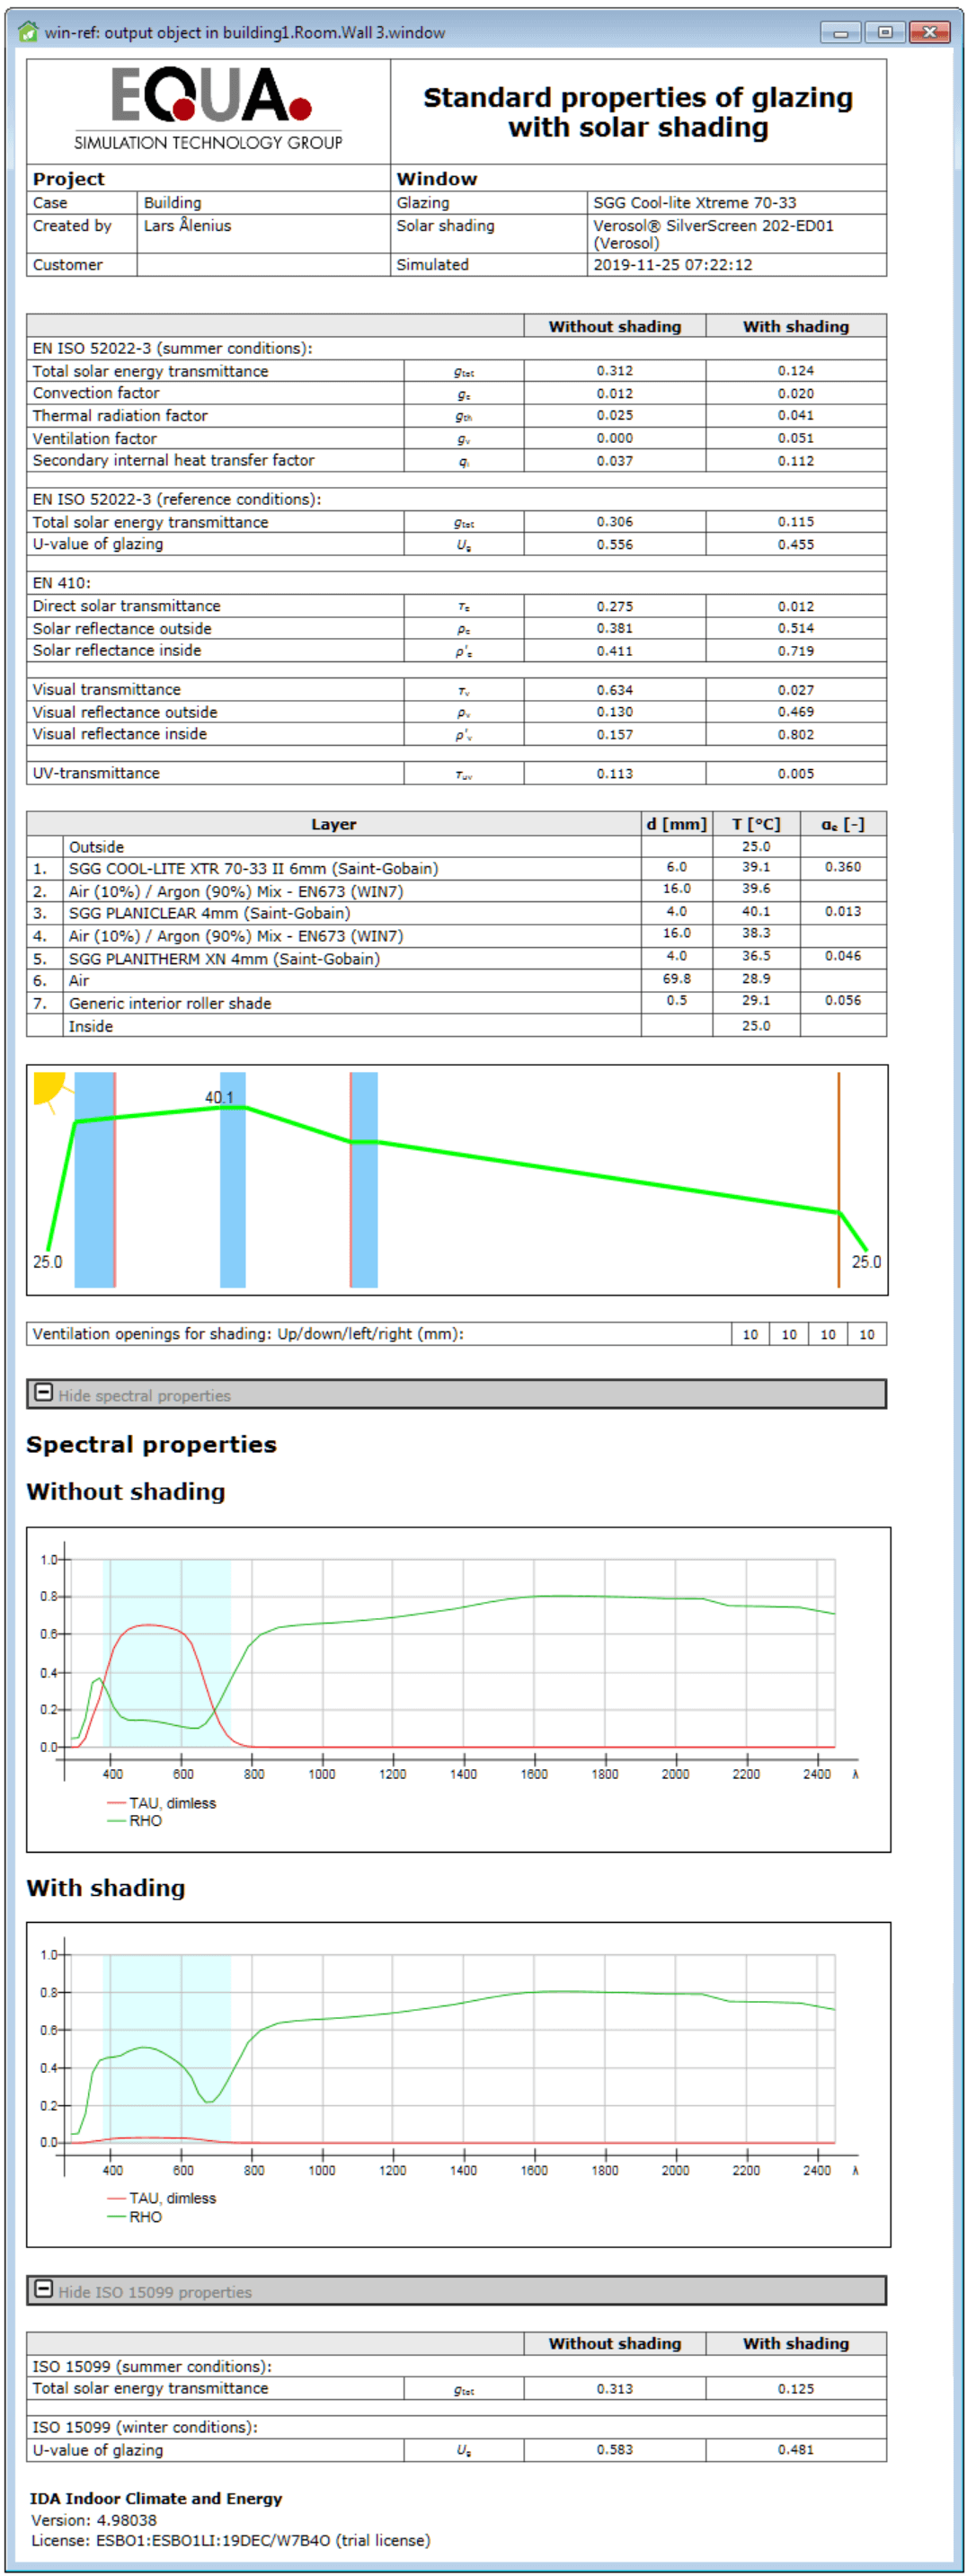
New glazing report
A new detailed glazing report has been developed with properties calculated according to EN ISO 52022-3, EN 410 and ISO 15099.
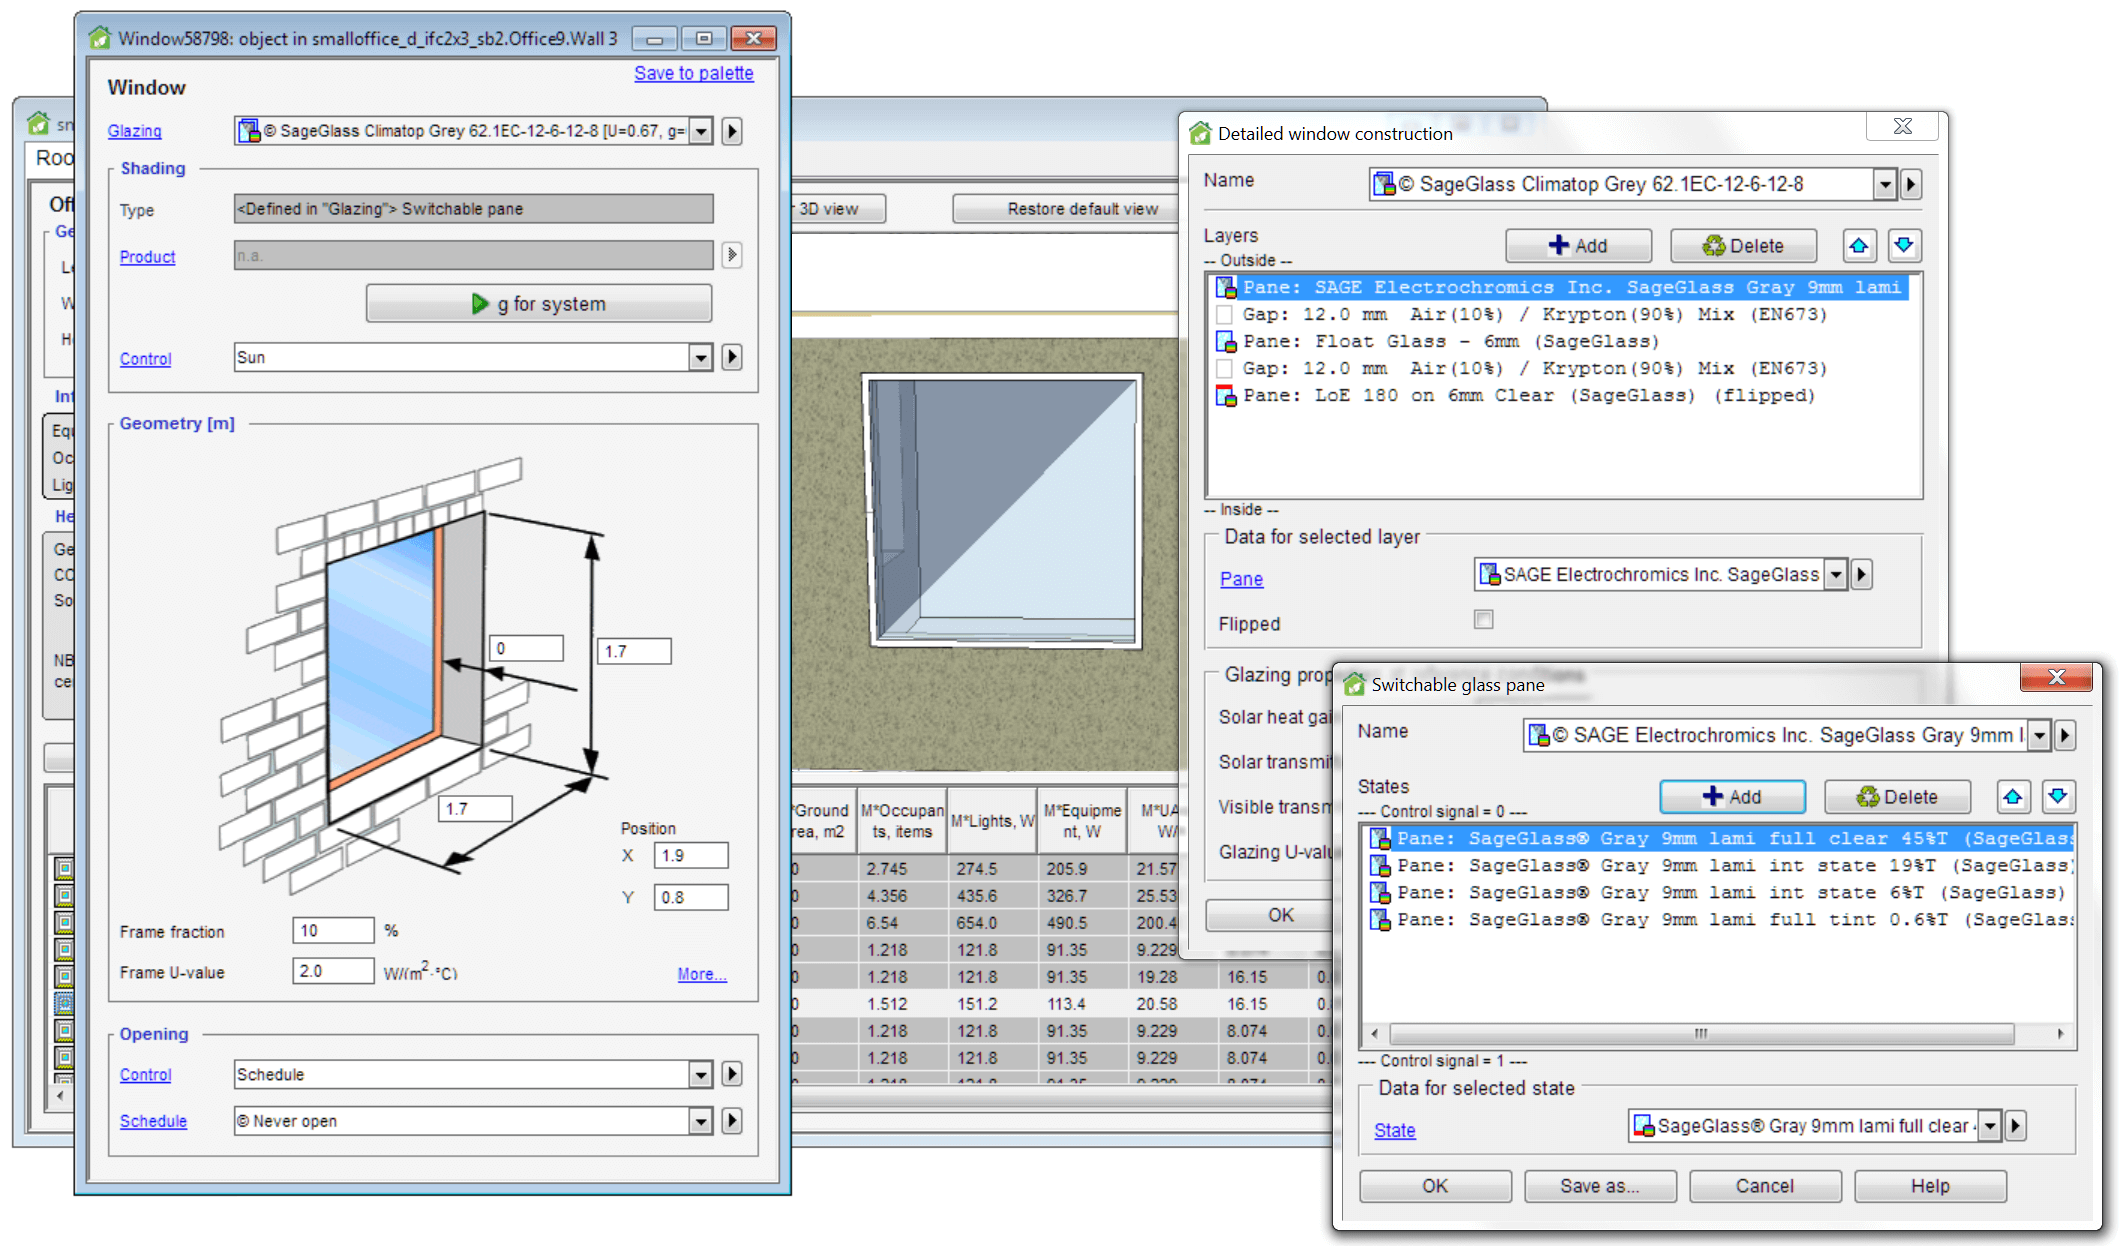
New types of integrated shading
Three new types of typical shading devices can now easily be selected for the detailed window model; Switchable glass panes (e.g. electrochromic panes), Interior vertical slat curtains and Exterior vertical slats. Access to manufacturer data for shading materials has been enabled. The shading devices are visualized in the 3D view.
New component models
|
IDA ICE 5.0 includes a number of new component models. Here are a few examples:
- Finite-difference underground duct model with wall condensation1
- Large vertical opening for the new stratified zone model1.
- Modelica implementation of energy zone model.
- New cooling coil (improved wet/dry modelling and flow-dependent UA).
- Improved solar collector (model and record in database).
- Passage opening control model for openings in a series (e.g. sliding doors)1
- New valve models (based on characteristic curves)1.
- New air handling unit with liquid based heat recovery.
- New air handling unit with direct expansion (DX) heat recovery.
|
New online help center
|
From IDA ICE 5.0 there is a central space with all documentation for your daily work available online at the EQUA WIKI. Press F1 within IDA ICE to access it. Use the search function.
|
Usability and productivity improvements
|
IDA ICE 5.0 includes a large number of usability and productivity improvements, many of them suggested by our users. Here are a few examples:
- Output report of calculation of total weight of materials for, e.g., LCA studies.1
- Select from a map when downloading weather data.
- To make it easier to work with multiple computer screens, most tabs and forms in IDA ICE open in windows that can be moved outside of the IDA ICE main window.
- Special simulations (such as cooling/heating load) at advanced level1.
- Wall parts, H/C floors, windows and openings with custom shape, e.g. triangular windows.
- ESBO-style default plant in ICE building with standard ICE boiler and chiller.
- Possibility to remove results of selected simulation.
- Possibility to edit the grid of windows/shading objects/PV panels in the dialog.
- A warning is shown when opening a file saved in a previous version of IDA ICE.
- More information in the list of resources.
- More detailed tooltips in diagrams.
- Progress bar shows total time in split-time mode.
- Revised energy meters to support variable and additional energy factors.
- Annotations tab on all objects where the user can take notes.
- Different parts of balconies can have different optical properties.
- Automatically generated measuring grids can be combined with user defined measuring grids in the same daylight calculation.
|
Improved memory management
The solver is updated to a 64 bit executable, which gives the possibility to simulate larger models with larger memory constraint (in principle 6TB) compared to the 32 bit 4Gb memory limit. It is still possible to run the 32 bit solver.
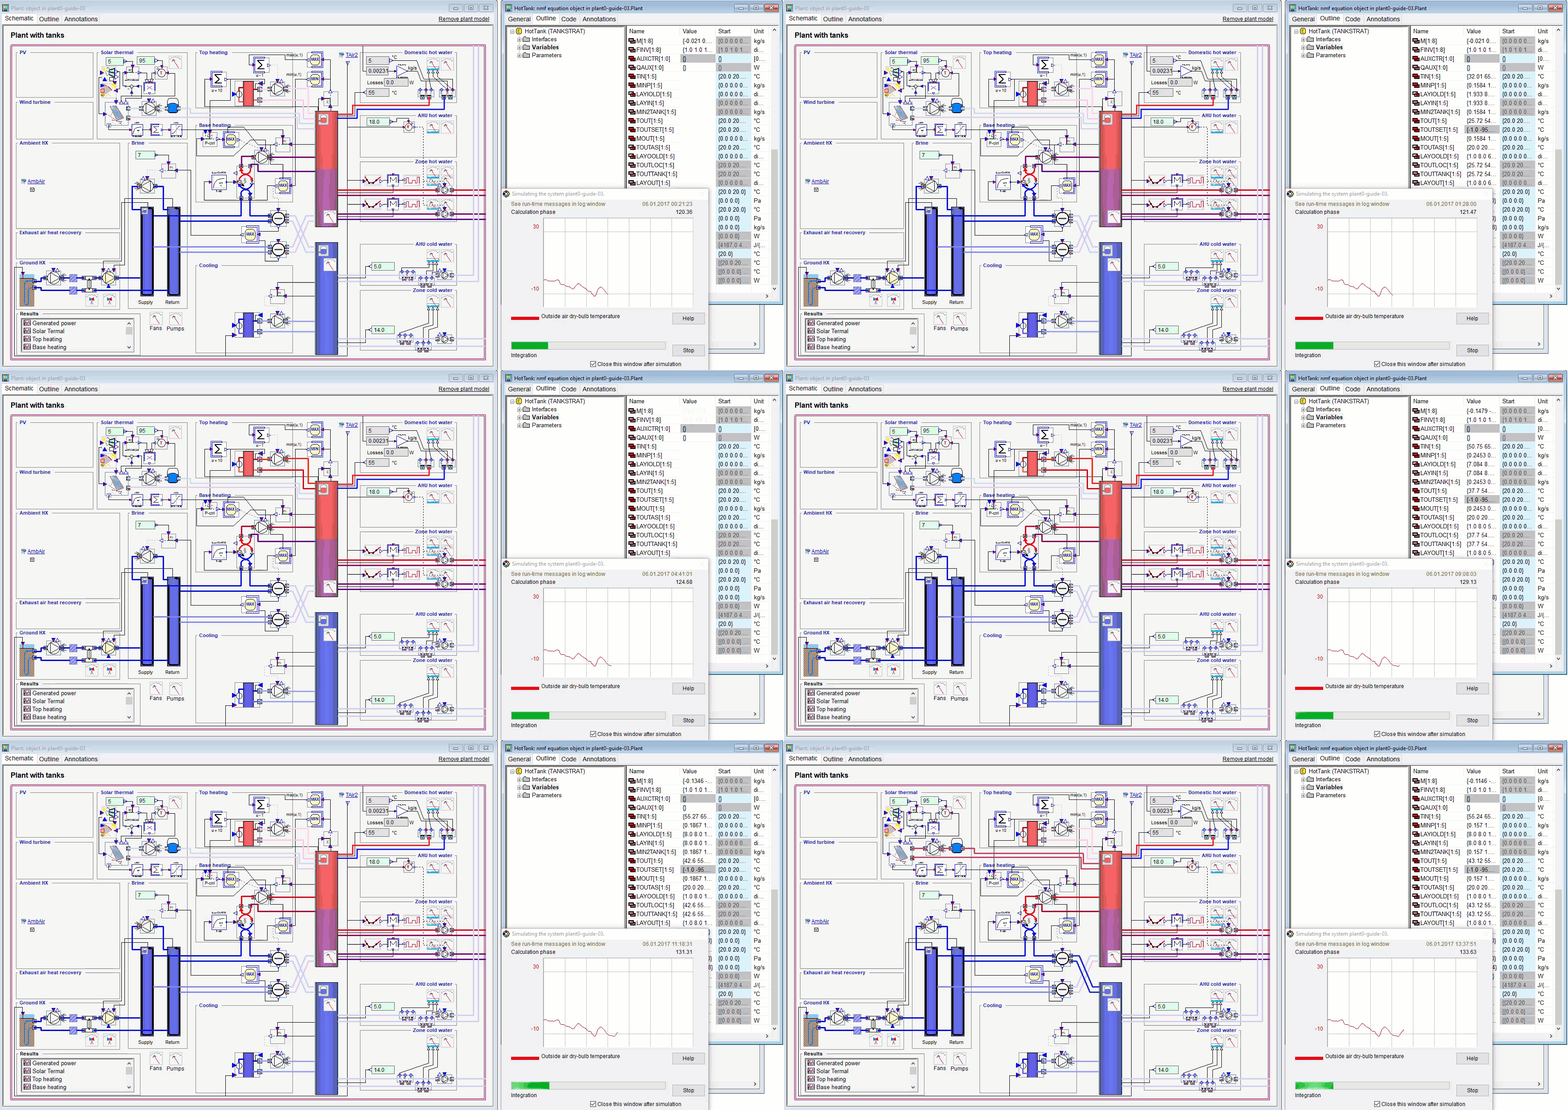
Real-time simulation feedback1
At the advanced level the changing variable values can be monitored during simulation by opening the outline of a component. In the schematic view connectors are updated according to temperature and mass flow.
Sensors can be added in the 3D view and variable values can be shown on the sensor or animated with colors on zones or imported geometry.
1 Included in the Expert edition.
2 Included in the Expert edition and available as extension (BIM Import) to the Standard edition.
Redesigned Floor plan
The Floor plan view and other 2D geometrical views have been redesigned to improve performance and ease of use:
- Mouse wheel zoom, pan and a function to zoom in on selected objects.
- New snapping algorithm with visualization of snap lines.
- Improved import of drawings with vastly better performance, showing more details and retaining the drawing’s coordinate system.
- New look with thin lines and transparent shapes.
- Intuitive rotation of the floor plan and roof editor to facilitate adding zones with different directions.
|

Spectral properties of glass panes and shading materials
Spectral calculation is introduced for glazing and integrated sunshades. This means that the properties of the whole glazing/sunshade system are calculated for each wavelength interval. Spectral calculations give higher accuracy than non-spectral. For modern glazing and shading materials, non-spectral calculations can give significant errors (> 10%) and viable system combinations may be missed. Spectral data can be uploaded by manufacturers at any time and is automatically synchronized with user databases.

Overheating calculation
Overheating calculation is a new simulation type to automatically find the worst day for rooms that have no or limited mechanical cooling. The result is presented at the time of either maximal air temperature, operative temperature or PPD.
Parametric runs and optimization inside IDA ICE (beta)1
Using the simulation model to optimize for example window properties, supply air temperature or the size and slope of solar collectors is an obvious application. With IDA ICE 4.8 this is as easy as it sounds. The user can easily drag and drop input parameters and target output (cost function) from the model into the interface. In addition to optimization, Monte-Carlo and sensitivity analysis (Morris method) are supported.
Graphical scripting in the same style as regular advanced level IDA modelling is provided in order to easily create parameter relations that are suitable for parametric runs. The same technique can be used also to formulate complex objective and constraint functions.
Enthalpy wheel heat exchanger
An air handling unit with a new rotary heat exchanger model, based on prEN 16798-5-1, is introduced. It has three options with different types of coatings:
- Uncoated: This type can transfer moisture only if condensation takes place in the wheel.
- Hygroscopic (enthalpy wheel): This type can recover some moisture even if no condensation takes place in the wheel.
- Sorption (desiccant wheel): Rotary heat exchanger for high humidity transfer. This type can recover even more moisture than the hygroscopic wheel.
|

New thermal bridge definitions
National standards are based on different conventions for defining thermal bridges and envelope area. IDA ICE 4.8 supports five different definitions of thermal bridges and envelope area, as defined in ISO 10211.
The selected envelope area definition is visualized in the 3D view when wall thickness is turned on.

Updates to Daylight2
The Daylight extension has been updated in IDA ICE 4.8. Here are a few examples:
- The Radiance parameters have been updated and a new option, Super high precision, is included.
- The median daylight factor and illuminance is displayed in the results summary table.
- The area above and below a daylight factor or illuminance value can be shown on the scalebar in the 3D view.
- The geometry of the ground is shown when visualizing properties in the Optical properties table.
- Zones for daylight calculation can also be selected from a list.
- Internal obstruction can easily be created inside IDA ICE as extruded geometry on surfaces.
|
Usability and productivity improvements
IDA ICE 4.8 includes a large number of usability and productivity improvements, many of them suggested by our users. Here are a few examples:
- New construction defaults: Separate construction for wall/slab parts facing ground.
- Possibility to remove all unused resources from the IDA Resources form with one click.
- More columns in the table of windows; Width, Height and Visible transmittance.
- Multi-selection of rows in tables (using Shift+click or Ctrl+click) and automatic scroll during selection of cells.
- Simplified form for water radiator.
- Windows and doors are now shown in the zone’s floor editor to facilitate positioning of occupants.
- Slab heating and cooling can now be used in vertical walls as well.
|
New types of integrated shading
Three new types of typical shading devices can now easily be selected for the detailed window model; Micro lamellas (shading dependent on two angles), Venetian blinds between panes and Screens between panes. Access to manufacturer data for shading materials has been enabled. The shading devices are visualized in the 3D view and their movement can be animated.
Improvements in 3D
The 3D view has been improved. Here are some examples:
- It is possible to add and edit shading buildings and horizontal shades directly in the 3D view.
- Properties of the 3D parameter visualization and results animation scalebar can easily be set including range, custom colors and arrow length.
- Icons for leaks and chimneys are shown in the 3D view.
|
Split and merge zones (beta)
Zones can now easily be split into smaller zones, by inserting a slab at a specified height or by drawing a dividing wall. With these features a complicated building can be divided into floors and zones.
Zones can also be merged together into larger zones. This feature enables you to change the zoning of a building without having to redraw the zones. It is also a simple way to create complicated zone geometries.
Improved IFC import and export3
The IFC import has been improved in several ways. Now also exporting key results via IFC has been implemented.
The free IDA ICE Viewer can be used to check IFC files for import problems.
Phase Change Materials (beta)1
Layers in walls and floors can now be Phase Change Materials (PCM). Using such materials, radically improved heat storage capacity can be achieved.
New model for heat from occupants
Thermal comfort is calculated in IDA ICE according to ISO 7730. In IDA ICE 4.7.1 and earlier, the heat loss from a person that is too cold (PMV < 0) was larger than the specified metabolism. In IDA ICE 4.8, the clothing level is adjusted instead so that the PMV value becomes close to zero, which means that the total heat losses always become equal to the metabolism. This change only applies to the calculation of occupant heat. The calculation of PMV/PPD is not affected.
Application Programming Interface (beta)1
IDA ICE can now be controlled by an external program by direct calls from, e.g. Python, Matlab, Excel, C++, Java or similar. By using socket communication, also processes on remote machines can control an IDA ICE instance. A library of functions based on the Document Object Model standard has been implemented for interacting with the IDA Modeller data structures. Essentially any operation that can be performed manually can also be done remotely. Running simulations from a remote process requires a special licensing agreement.
Top of page
1 Included in the Expert edition.
2 Included in the Expert edition and available as extension (Daylight) to the Standard edition.
3 Included in the Expert edition and available as extension (BIM Import) to the Standard edition.
Highlights in 4.7
Daylight1
Advanced daylight calculation by interfacing the Radiance™ lighting simulation tool. Easy calculation setup, execution and results visualization, all inside IDA ICE. Calculation of daylight factor and illuminance on selected zones or user defined measuring planes placed inside or outside of the building. Selection of sky models including CIE standard sky models and Perez climate based sky model. Results presentation with average, minimum, maximum and uniformity ratio and color coded field visualization including possibility to show percentage of area above or below a threshold value.

Parallelization2
IDA ICE now takes advantage of the fact that almost all new computers are equipped with multiple processor cores and are able to run several processes in parallel:
- The simulation can be split into several shorter time segments which are simulated in parallel.
- All cases that are presently open in the session can be simulated in parallel on several processes. This is a simple and efficient way to run a batch of cases.
- Different versions are simulated in parallel on several processes (using the version handling system).
- The RadianceTM daylight calculation of different zones, measuring planes and time points are distributed on several processes and run in parallel.
- Start additional IDA ICE sessions from the file menu. In this way you can work on several sessions in parallel, both during modeling and during simulation.
|
Windows and shading devices
New features for windows and shading devices:
- Six different types of typical shading devices can easily be selected for the detailed window model. Access to manufacturer data for different shading materials has been enabled. The shading devices are visualized in the 3D view and their movement can be animated.
- For both simplified and detailed windows, drop arm and markisolette external shading devices can easily be defined without drawing. These shading devices are visualized in the 3D view and their movement can be animated.
- It is now possible to create custom control macros for external shading devices², and the default location of the light sensor is now on the outer side of a window.
|

Climate data
New features for climate data:
- New design-day data from the ASHRAE Fundamentals 2013 database for 6443 locations across the world is now available. This data contains hot (and cold) extreme days for every month of the year, allowing you to compute cooling loads also for ‘unusual’ months.
- New hourly weather data from the IWEC2 data set for 3012 worldwide locations (many of them matching the design-day data).
- The climate data is automatically adjusted to compensate any longitudinal difference between the building and the weather station.
- Easy download of missing climate data.
|
New cooling load calculation
A new cooling load calculation algorithm with automatic detection of “the worst day of the year” has been implemented, using monthly extreme weather data from the ASHRAE Fundamentals 2013 database. For modern buildings with low transmission losses, room cooling loads may peak in February or March, not during the summer as could be expected. The new method will detect this automatically. It will also automatically save peak design days for each zone and air handling unit as well as for the primary cooling system.
Results
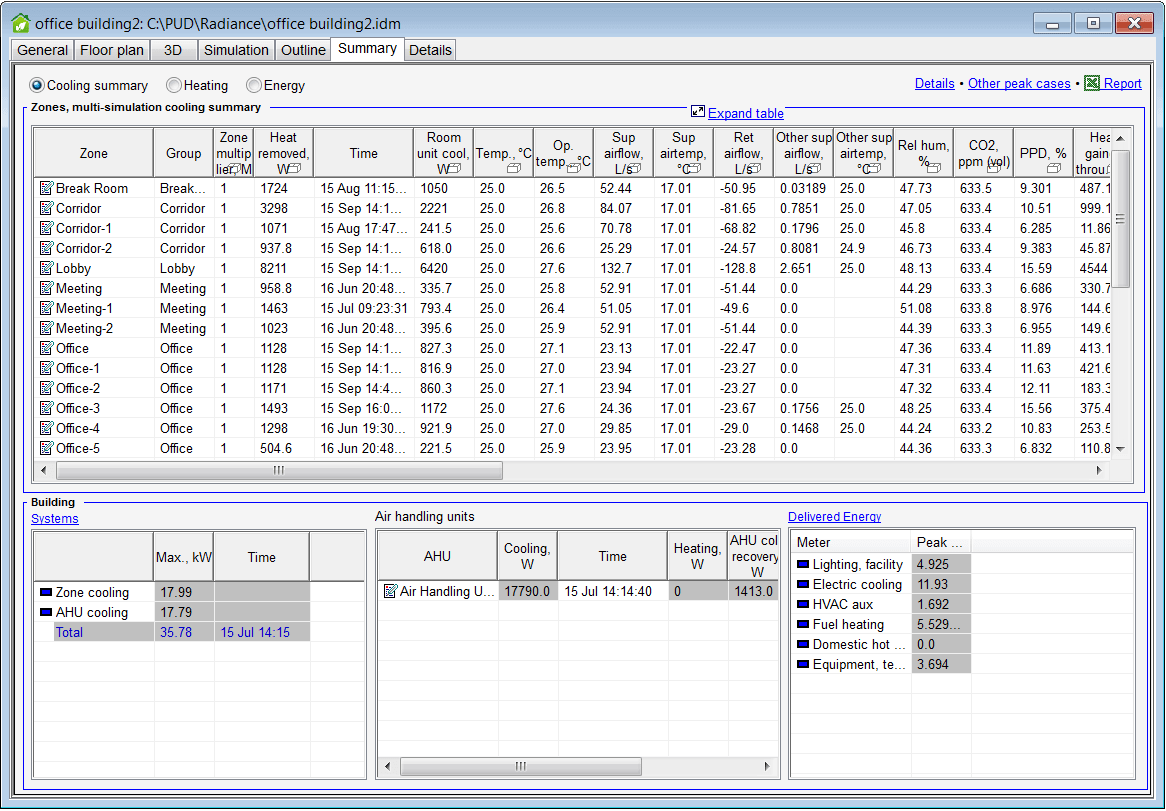
Results of multiple simulations are now saved with the project file, and the Results tab has been replaced with two new tabs; Summary and Details. The Summary tab includes summary tables for the zones, air handling units and the building. For cooling load calculations, a summary of individual peak cases is presented. The Details tab features new ways of presenting multiple diagrams together, and it uses snapping crosshairs for easy reading.

Simulate selected zones
Selected zones can automatically be cloned to a new model. This makes it quick and easy to study the behavior of these zones, without having to run the whole original building.
IDA ICE Portal
A portal is now shown at startup, featuring IDA ICE related news, information about upcoming events, links to video tutorials and the latest forum posts. It also includes contact information and a license summary.

Improved IFC import3
It is now possible to map IFC space types to zone templates, and to convert all IFC spaces to zones in one click.
Import of IFC files, validated with the IDA ICE add-on for simplebim, has been improved:
- For curtain walls, transparent panels are imported as windows and non-transparent panels are imported as walls.
- The building body can now be defined by a separate space object in the IFC file.
|
Merge zones (beta)
Zones can now easily be merged together into larger zones. This feature enables you to change the zoning of the building without having to redraw the zones. It is also a simple way to create complicated zone geometries.
New ESBO version
A redesigned version of ESBO (Early Stage Building Optimization) is released, including:
- Manufacturer data for room units and solar protection devices are now available directly in ESBO as well as in IDA ICE.
- Possibility to remove the hot and cold tanks. The default model is now size-free and without tanks.
|
VELUX EIC Visualizer Professional
The professional version of VELUX Energy and Indoor Climate (EIC) Visualizer is now included. The VELUX EIC Visualizer focuses on windows and solar shading and is used to evaluate the performance of single-family houses with respect to energy, ventilation and indoor climate.
Read more >
More features in the Standard edition
Features previously only found in the Expert edition, or in the extensions Enhanced Windows Models4, and Slab Cooling and Heatings, are now included directly in the Standard edition:
- Openable windows and exterior doors.
- Natural ventilation controlled by schedules (arbitrary control function block diagrams with the Expert edition).
- Simulate ventilated double skin facades and other complex glass facades.
- Detailed pane-by-pane window model according to ISO 15099 is included, allowing for more realistic and detailed simulation of windows. Properties for each layer (panes, cavities and shades) can be defined, making it possible to construct arbitrary window configurations. An extensive database is included.
- Handle embedded heating and cooling systems (TABS) – both water based and electrical.
- Combined heating and cooling panels.
|
Debugging of advanced level systems2
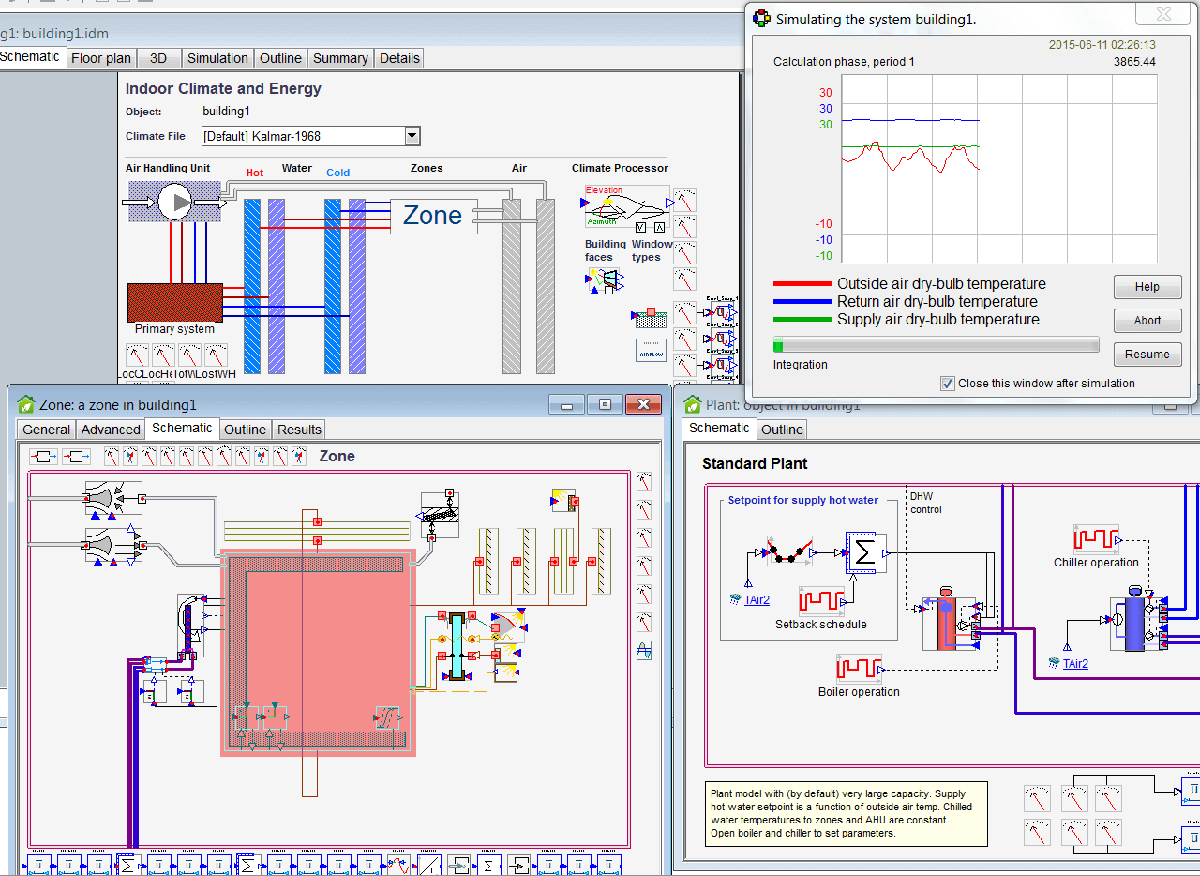
When the advanced level is visible during simulation the slowest converging component is shown in red each time step. With this feature, problematic component models are more easily detected.
Fan-coil model
A new dedicated fan-coil model is available that has more appropriate parameters and that is numerically more efficient. By setting the fan-power to zero, this model can also be used as an “ideal unit” that connects to the hydronic system.
Compressed binary file format
The default option is now to save the entire IDA ICE project in one single binary file. This makes it easier to copy IDA ICE projects and to incorporate them in file handling systems.
Autosave
Your IDA ICE project is now automatically saved every 10 minutes, and before and after each simulation.
Control macros2
New features for control macros:
- Ideal coolers and heaters can now be controlled by custom control macros.
- In custom control macros, the access to parameters of a controlled device is made easier. No script is required.
|
Exhaust air heat pump
Exhaust air heat pump is now available at the standard level of IDA ICE. It is quick and easy to set up a heat pump with liquid-coupled exhaust air heat recovery and storage tank. Sizing of flow rate and heat pump is supported.
Split5 and merge zones (beta)
Zones can now easily be split into smaller zones or merged together into larger zones. These features enables you to change the zoning of the building without having to redraw the zones. It is also a simple way to create complicated zone geometries.
New liquid circuit between AHU and Plant
A new custom liquid circuit between the air handling unit and the plant simplifies the generation of arbitrarily system models.
Top of page
Highlights in 4.6
New help center
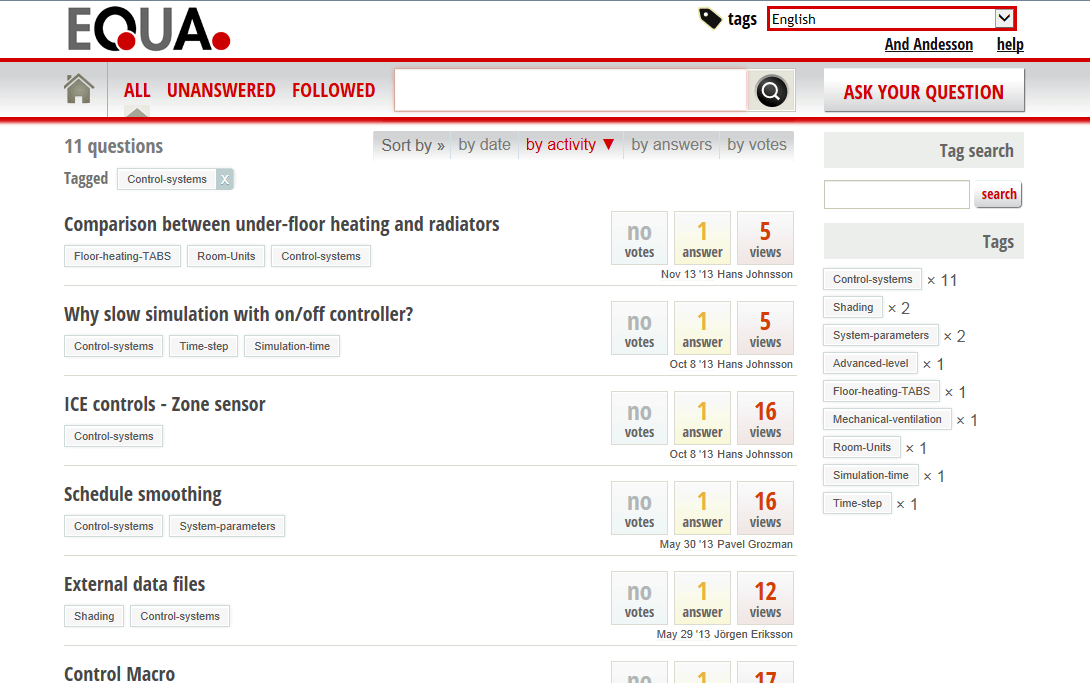
The help system has been improved. Apart from an updated user guide, context sensitive help and process guides with tutorial movies, a completely new knowledge database/user forum has been added, which gives a new level of support to all types of users. A new Download & Info Center has been created with change logs, known bugs, validation reports, certificates and additional documentation.
New climate file download center and file formats
A new download center makes it easy to select the weather files that you need. More than 3000 worldwide ASHRAE IWEC2 weather files are now available.
Diagram functions
|
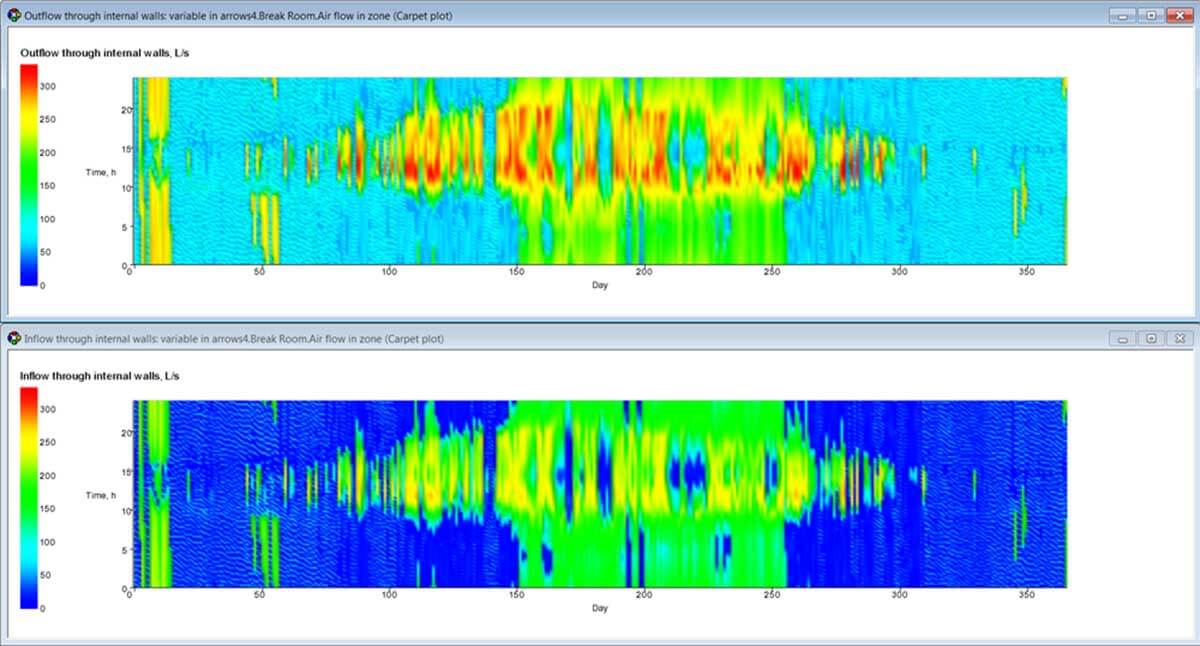
New features in the visualization kit:
-
Carpet plots (color-coded variables) support pattern recognition.
-
Show a diagram with the same variables from all or selected zones.
-
More options for the duration diagram; display time over or under a certain limit.
|
Glazing and shading from detailed window
Design glazing and shading properties in the detailed window model, calculate and save the key parameters, and they are available in the simple window model.

More options at the standard level
-
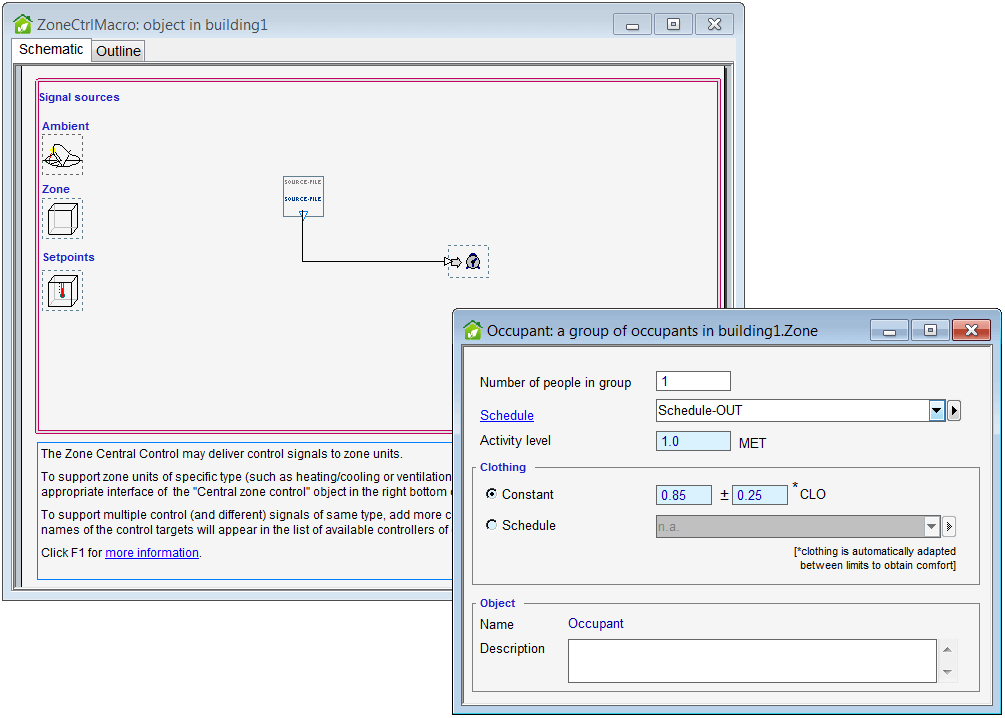
A new option allows the replacement of a schedule with the output signal of a control system. For example, an occupancy schedule could be given in terms of a measured signal from an occupancy sensor.
-
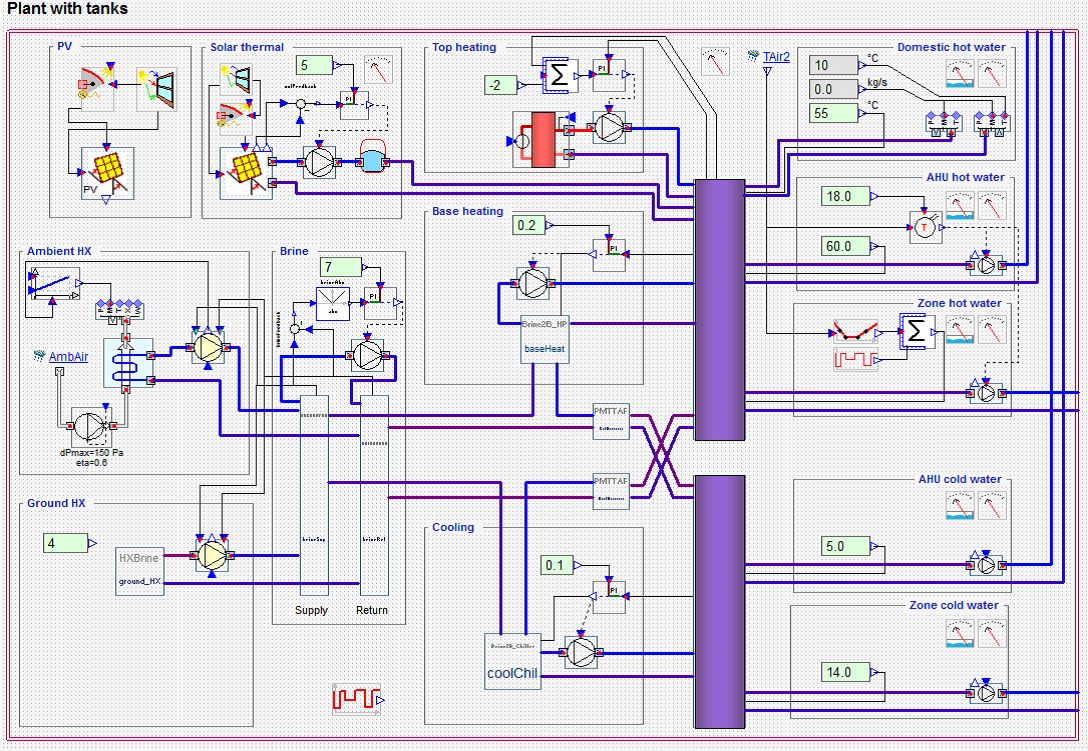
It is now possible to create a schema view of the ESBO plant at the standard level. The ESBO plant can then be edited in detail.
-
Select which circuit you want the local AHU to be supplied from.
-
Air flows may be given for leaks.
|
Geometry
-
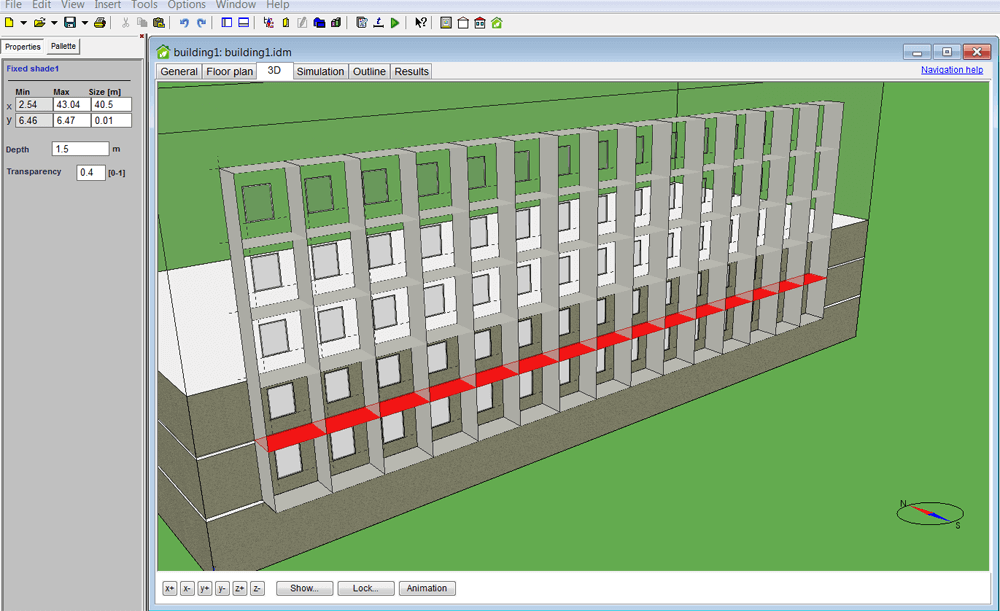
Additional shading objects, such as fixed shade and fixed fins, can be inserted onto facades in the 3D view.
-
It is now easier to add multiple features, such as windows and openings, on the floor plan by repeated clicking.
-
View and edit the sill height of windows in the overview table.
-
Change the position of IFC models, for instance to another height coordinate.
-
It is now possible to import .skp files also from SketchUp 2013.
|
IDA ICE Viewer
A free viewer makes it possible to open simulated project files, look at results and run 3D animations. Project files can be exported from IDA ICE to a protected format which is only possible to open in IDA ICE Viewer.
Shading calculation
External window shades, shading buildings and imported shading objects now include a transparency parameter so that semi-transparent shades can be defined.
New 3D animation
It is now possible to log and animate window integrated shading.
Improved 3D navigation
The navigation in the 3D view is now easier than ever with mouse wheel zooming and a function to zoom in on selected objects.
Top of page
Hightlights in 4.5
Early Stage Building Optimization (ESBO)
ESBO is a new IDA ICE wizard that simplifies early stage building optimization. It allows you to experiment with variations in both building and systems with an absolute minimum of user input.

Renewable energy systems
New models for heat pumps, solar collectors, stratified storage tanks, boreholes, CHP, wind turbines, PV and other free energy sources make it easy to simulate innovative systems.
Complex zones and buildings
It is now possible to use arbitrary geometries for both zones and building bodies, including models with holes. The geometries are imported from SketchUp or other geometry tools. Objects may be moved in the 3D view.
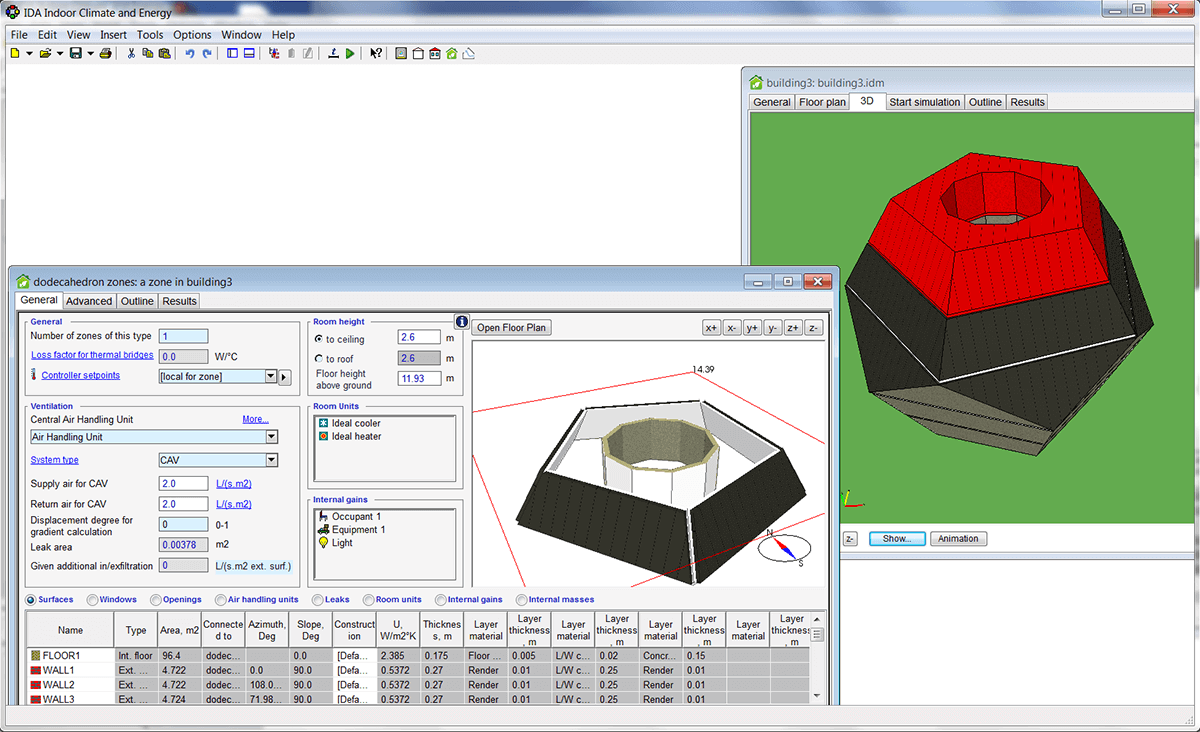
New 3D look
A completely new 3D look, similar to SketchUp. Other improvements include shadows falling on the ground and the possibility to toggle zone wall thickness, x-ray view of external shades, imported objects and IFC models.
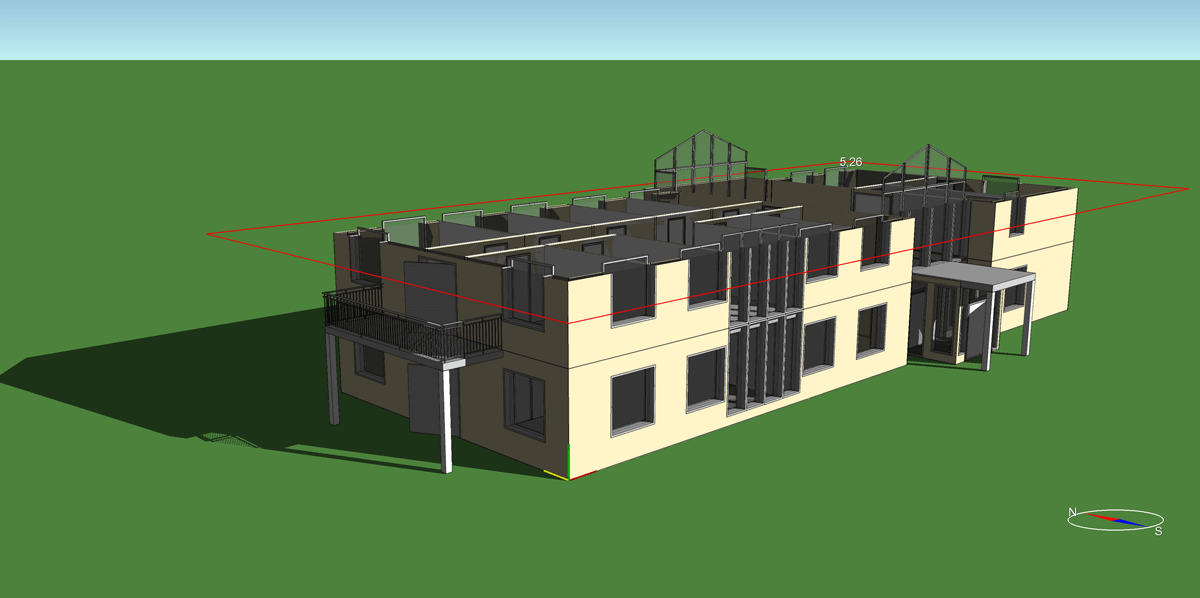
New 3D animations
A new type of arrow animations in 3D has been added, visualizing ventilation air flows, window energy balance and wind velocity vector. Selected variables can be displayed in a table in the 3D view during animations.

Façade windows and shading objects
Windows, openings and shading objects can now, directly from the 3D view, be inserted into a building body, which speeds up the workflow significantly. A new grid object enables efficient management of large groups of repeated objects such as windows.

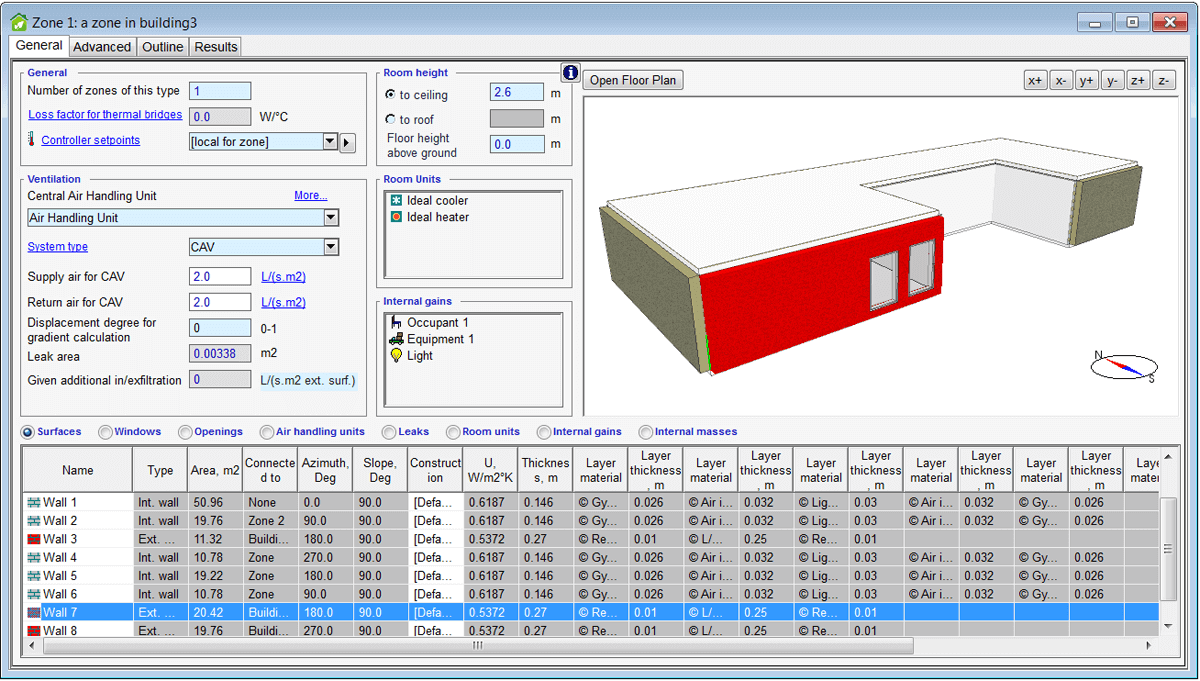
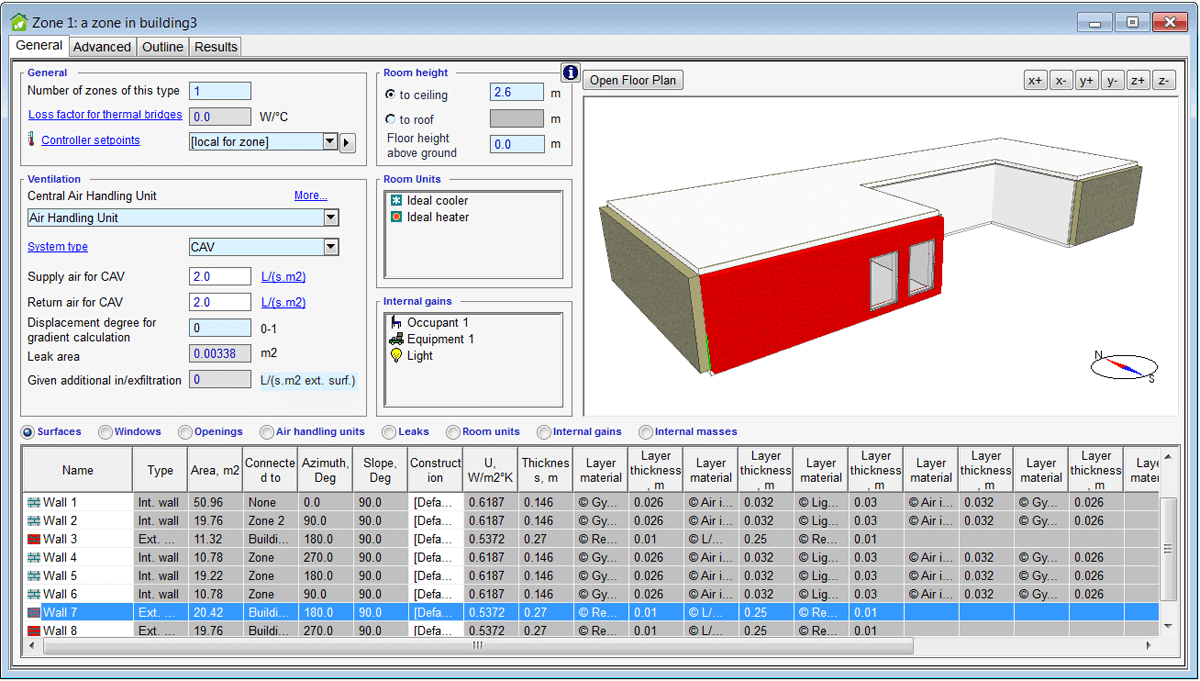
Improved zone form
A new improved zone form with 3D view and summary tables has been developed. The new summary tables make it easy to view and edit all important zone level input data.
New custom controls
It is now possible at the standard level to customize your own controllers for all devices such as room units, blinds and lights. Supervisory controllers may also be defined at both the zone and building levels.
Multiple area definitions
Support for different types of floor area metrics. It's also possible to set the zone or building floor area explicitly to match exotic area calculation standards.
Improved zone loads
More flexible handling of zone loads. Support for multiple light objects. Domestic hot water may be specified as a function of time and on the zone level. Equipment can now emit water mist and an equipment utilization factor has been added.
Thermal bridges
New thermal bridge elements have been added. The new elements support inner corners and inner walls meeting external slabs.
Lots more…
Discrete-time (sampled) controllers; new input data report; externally updated resources – to manage group, project or company libraries, etc., etc.
Top of page
Highlights in 4.2
Process Guide
The Process Guide helps to get started in new projects. Here the basic steps for constructing a model are listed, with direct links to the place in the user interface, to instructive movies and to help texts.
Expandable forms
Forms now expand automatically when resizing the application window. This will radically improve the use of screen real estate for users with big screens, especially regarding the appreciated input data tables.
Added tables
New input data tables added for setpoints, room units, energy meters and HVAC systems in the General tab. A new system for adding even more tables in the future has been developed.
3D visualization of surface data
For the Surfaces input data table, the columns Type, Construction and U-value are now shown in the 3D view, also separately for every subsurface. This makes it much easier to visually verify that constructions have been defined as intended.
Energy meters button added
A button to show usage of energy meters has been added, making it much quicker than before to find how meters have been used.
New zone sensor
A new zone sensor object for reading a zone's variables in AHU and Plant simplifies cycling of AHUs.
Hierarchical structure
The windows in the Window menu are shown in hierarchical structure. This makes it much easier to locate windows that have been covered on the screen, especially when several models are open.
Drag-and-drop of variables
Support for dragging (drag-and-drop) additional variables into cross-dependency (scatter) plots. This makes it easy to generate for example a plot of hourly energy use as a function of outdoor temperature.
Batch mode enhancements
It is now possible to run heating/cooling design and energy calculations in batch mode, as well to run scrips (without popup dialogs).
User defined lighting control
It is now possible to define your own control strategy for lighting.
Top of page
Highlights in 4.1
Undo and Redo
Unlimited undo/redo has been added.
Support for SketchUp format
It is now possible to import shading objects using SketchUp models (.skp).
Enhanced IFC import
Improvements to the IFC import has been done, especially when positioning doors and windows in walls, improved external corners and support for multilevel spaces.
Enhanced diagrams
It is now possible to sort variables, to have multiple stacks and to draw values in stack bar diagrams. Tooltips and context menu works now with area diagrams and with bar chart diagrams. More options have been added for the axes.
Visualization of twist and tilt
It is now poissible to visualize the horizontal twisting and vertical tilting of window surfaces.
Listing of shading layers
The shading layer of detailed windows are shown in the list of windows.
Infiltration units
New alternative for infiltration units has been added: m3/(h.m3 ext. surf.)
Colorized code
NMF and Modelica source code is now colorize, which makes it easier to read.
Reset zones
Zones can be resetted to the current template.
Refresh 3D view
It is now possible to rebuild the building in the 3D view.
Memory limit added
It is now possible to manually set the memory limit utilized by IDA ICE.
Top of page
Highlights in 4.0
3D environment
The new real-time 3D environment makes it possible to illustrate input and output parameters and to get animated results, including solar and shading graphics. It also adds an overview during all steps of a project and provides impressive presentation graphics. You can quickly edit properties by simply clicking, e.g. a wall or a window in the 3D-model.
Overview tables
New overview tables allow the user to get a complete overview of individual parameters of complex models. You can view and edit all important input data in tables and see, e.g., useful totals for floor areas, u-values, external wall areas, etc. These tables can also be transferred to and from Excel. Most parameters can be visualized in the 3D environment.
3D BIM import2
Support for import of 3D models in IFC (Industry Foundation Classes).
Cooling, heating and energy
A simple procedure for calculating and reporting cooling, heating, air demand and energy has been added.
Version Handling System2
The Version Handling System allows you to keep track of changes between model versions and also to automatically rerun all cases that depend on a change. It can be used to retain manual advanced level operations when a change has been made at the standard level.
Improved support for Air Handling Units and Local Units
A range of new pre-defined AHUs have been added, e.g. for night cooling and simultaneous feedback control of zone temperature and humidity. Zones may be served by multiple AHUs and custom built local units, e.g. fan-coils, local ACs and heat pumps.
Complex geometry
Support for more complex building and roof geometries. A separate Roof Editor makes it easy to define and modify roof constructions.
Demand-controlled ventilation
Improved demand-controlled ventilation strategy where a combination of carbon dioxide concentration and temperature can be used.
Custom control systems2
For VAV-systems, window shading and openable windows it is now easy to make custom-made control systems at the standard level. An extensive library of control function blocks is included.
Solar beams
An advanced algorithm for how solar beams are hitting and penetrating the building has been added. It also takes into account whether the beams passes several layers of internal windows.
New window model2
A new pane-by-pane window model according to ISO 15099 has been added. Available in the Enhanced Window Models extension.
Model searching and differencing2
Easy to search models and to list differences between models. Differences can also be captured as editable scripts, the application of which will convert one model to the other.
Diagrams and reports
Improved diagrams and reports. Supports larger plot-files. Signals can be dragged between diagrams for comparison. Reports are based on HTML with tables that will remain tables when moved to Excel.
Modelica language
Support for models written in the Modelica equation-based language.
Climate files
Easy to download and install climate files to the database. EPW files can be directly downloaded and installed from any public site.
Top of page
1 Included in the Expert edition and available as extension (Daylight ) to the Standard edition.
2 Included in the Expert edition.
3 Included in the Expert edition and available as extension (BIM Import ) to the Standard edition.
4 It will not be possible to create internal openings and large horizontal openings in Standard edition. For this the Expert edition is required.
5 Available from IDA ICE 4.7.1
Print
Email
 English
  Svenska
  Deutsch
  Suomi
Suomi  中文(简体)